

How to Create an Executive Summary Slide from a Long PDF Report
Turn a PDF report into one executive summary slide with a worked example, three evidence points, a clear approval request, and three layout options.
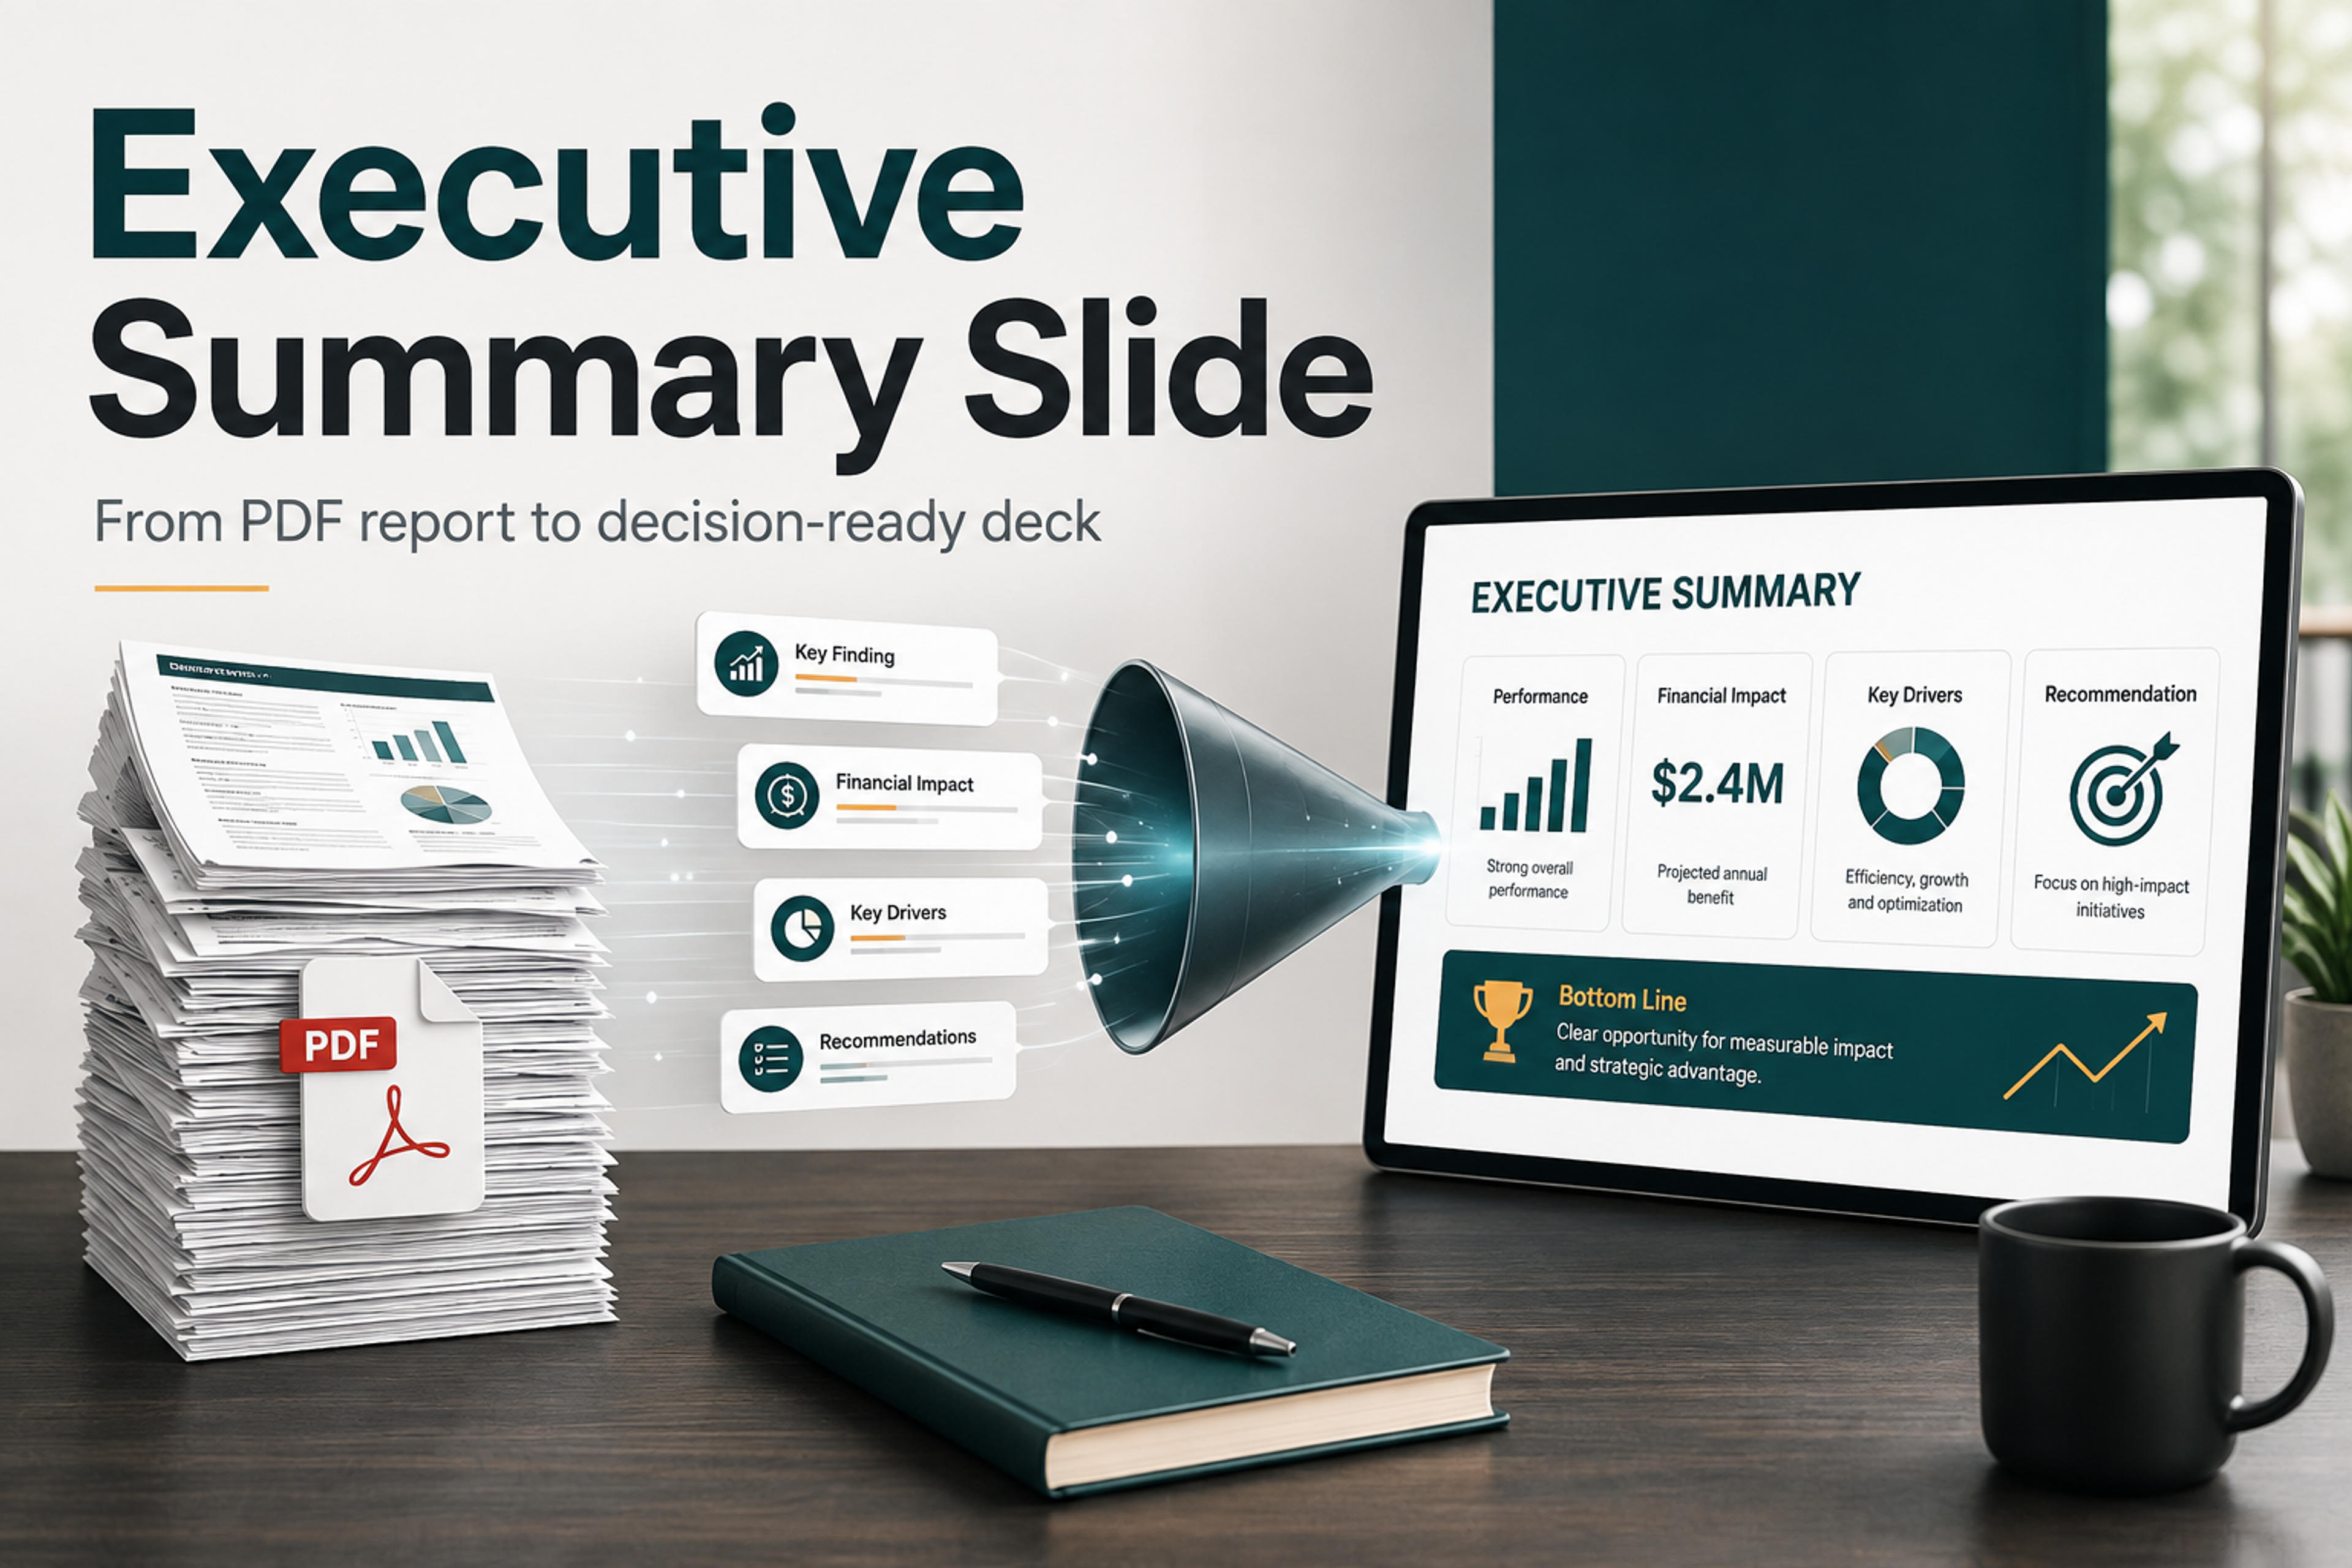
Turn a PDF report into one executive summary slide with a worked example, three evidence points, a clear approval request, and three layout options.
A strong executive summary slide does not try to miniaturize the whole PDF. It makes the report usable for a decision maker. The slide should show what changed, why it matters, what evidence supports the recommendation, and what action should happen next.
That means the real work is not copying the PDF into PowerPoint. The real work is choosing the point of view. Once the message is clear, the slide design becomes much easier: one headline, a small set of proof points, and a visual structure that lets a busy executive understand the report without rereading it.
The following fictional operations report gives us one source to work from. All figures, dates, and proposed actions are illustrative; this is not a customer case study or a SlidesPilot-generated result.
Northstar Services — onboarding pilot review, September 18, 2026
The operations team compared two consecutive groups of 40 new accounts. The June group used the existing onboarding process; the August pilot group used a standard kickoff checklist and two scheduled support sessions. Average time to first value fell from 15 days in June to 9 days in August. Accounts completing onboarding within 14 days rose from 24 of 40 (60%) to 34 of 40 (85%). Support time increased from 80 to 120 total hours per group, or from 2 to 3 hours per account. The groups were not randomized, so the comparison does not isolate the effect of the new process.
The operations lead proposes an October extension for 80 new accounts. At the observed rate, the extension would require 240 support hours in total, including 80 hours above the existing process. At the planning rate of $75 per additional support hour, the requested incremental budget is $6,000. The COO is asked to approve the extension by September 25. The operations lead will report results on November 6; wider rollout will be considered only if average time to first value remains at or below 10 days, at least 80% of accounts complete onboarding within 14 days, and support time stays at or below 3 hours per account.
Here is that report condensed into one complete slide. The recommendation is at the top, three evidence cards fill the middle, and the exact approval request runs across the bottom.
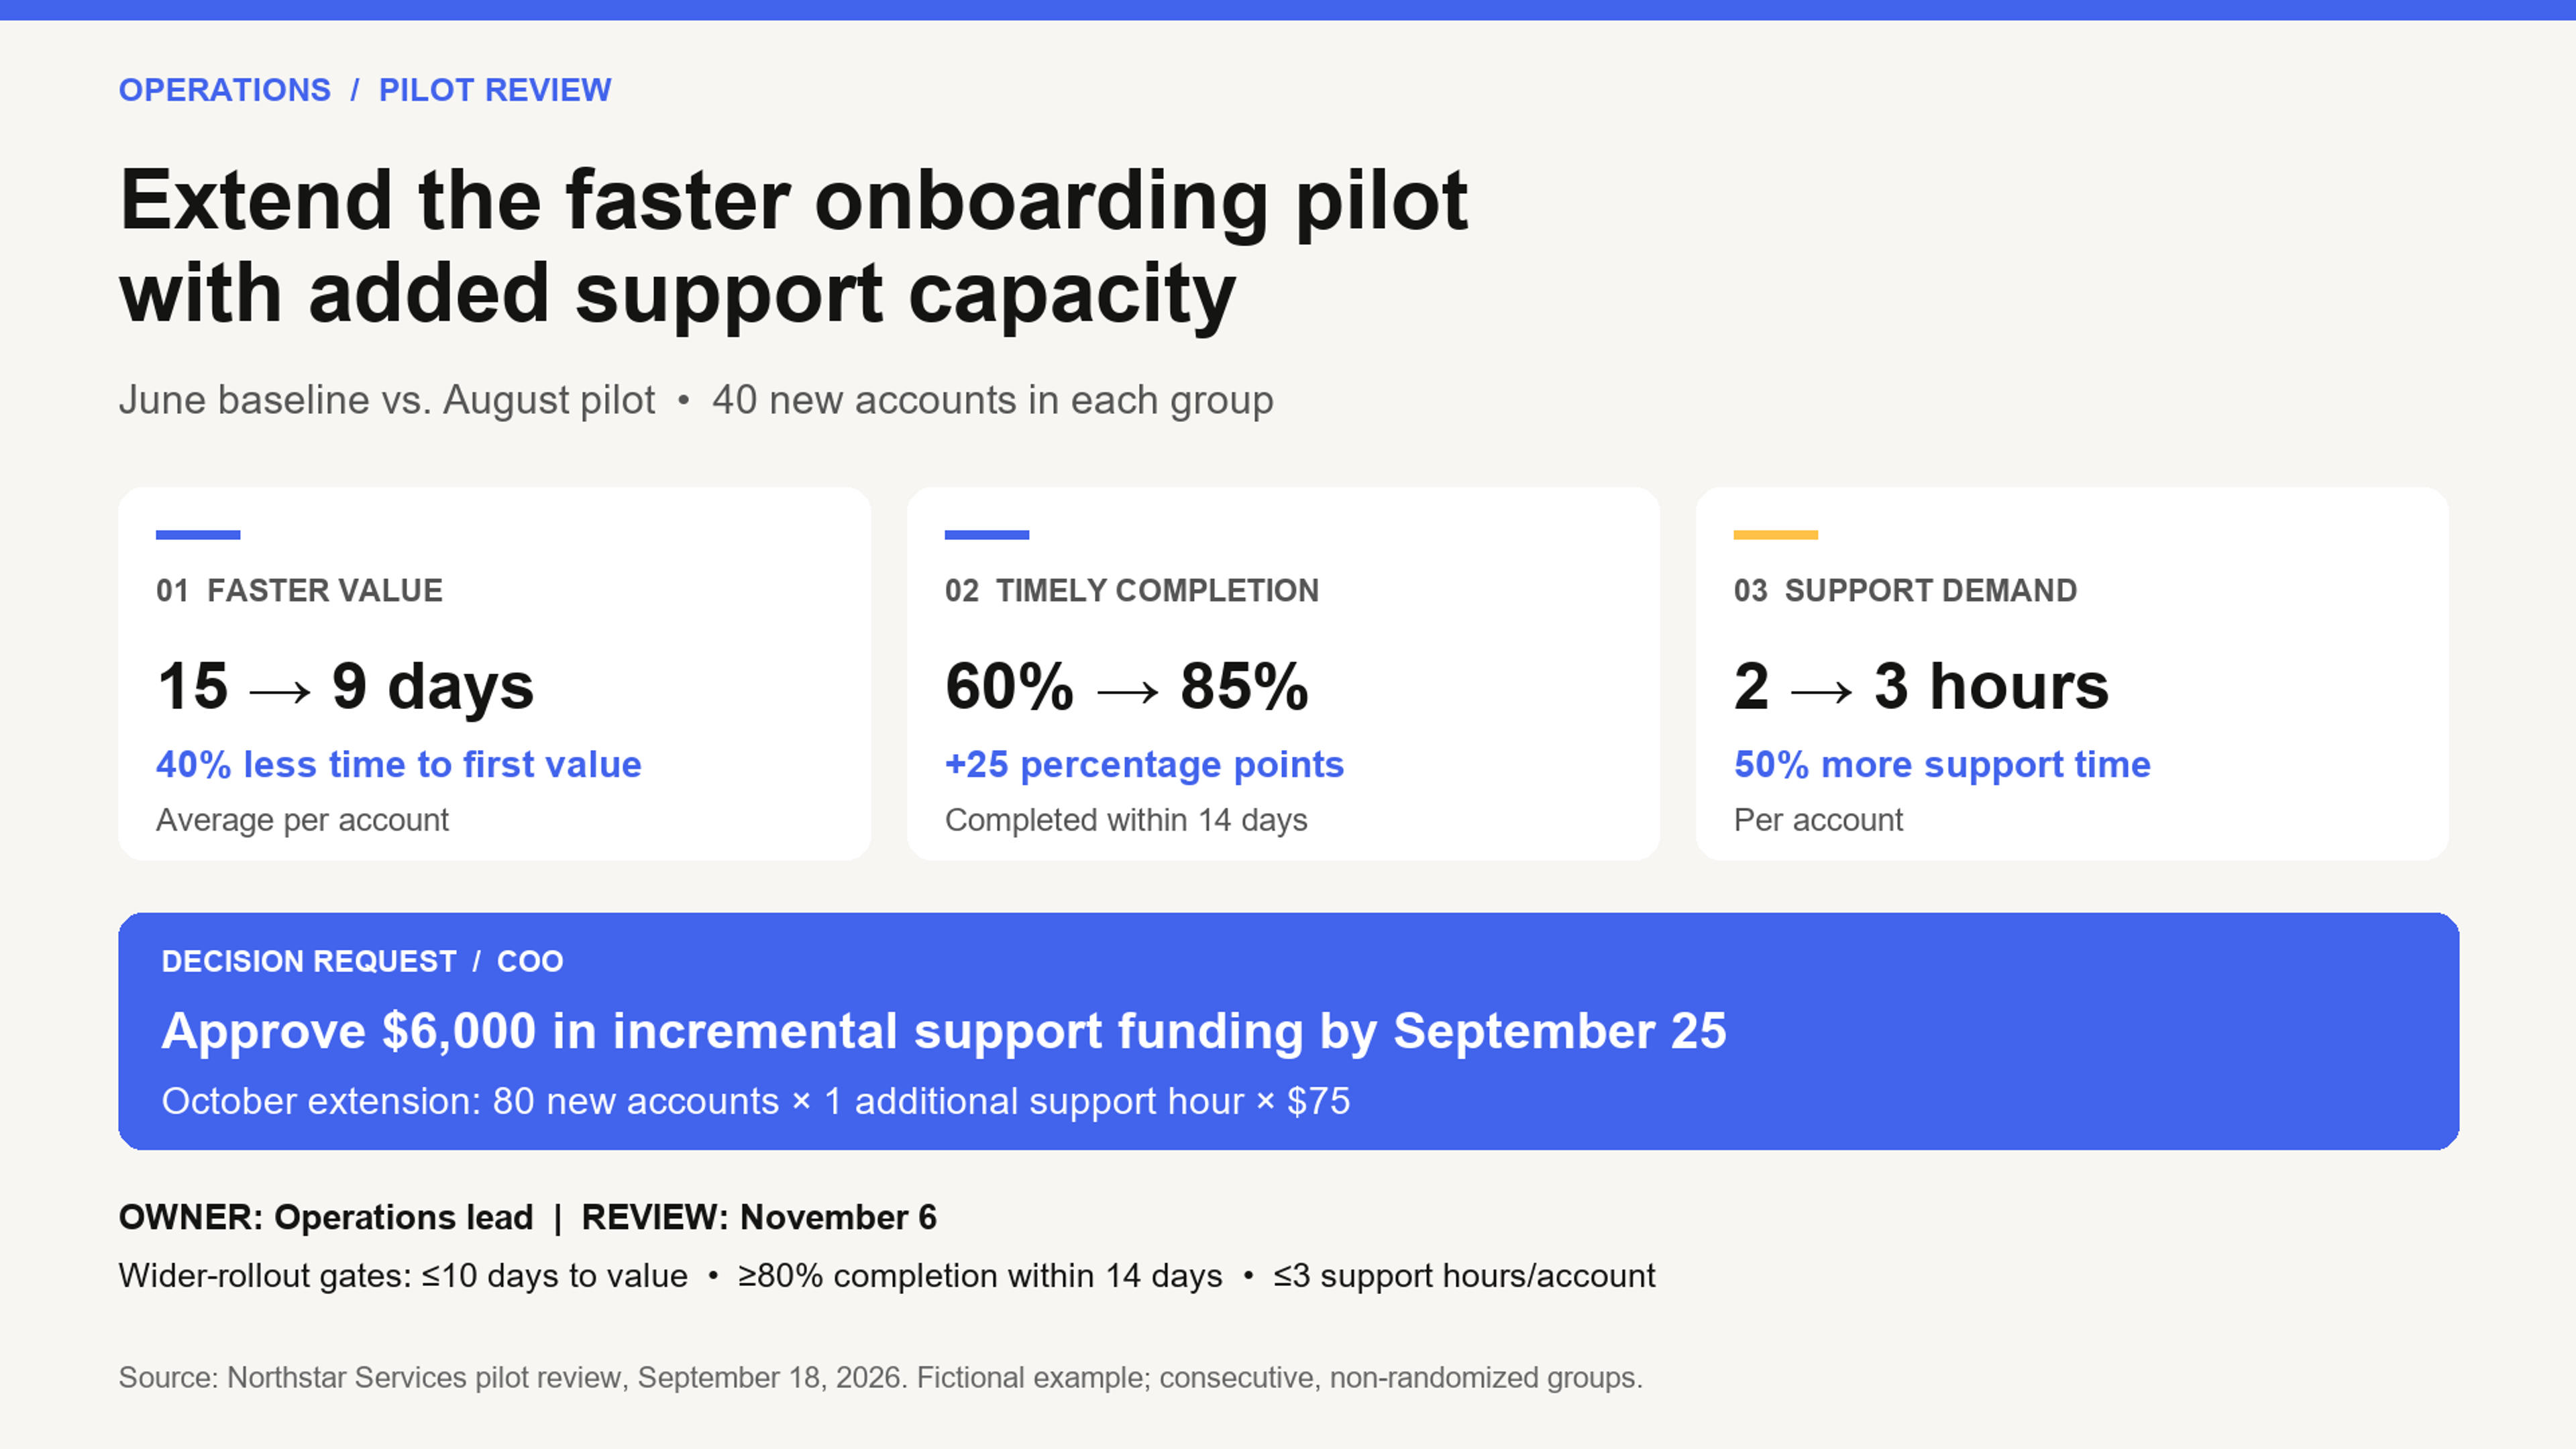
Slide copy you can reuse:
The title turns the results into a bounded recommendation: extend the pilot with the capacity it needs. It does not jump straight to company-wide rollout. The non-randomized comparison supports further testing without claiming that the new process alone caused the improvement.
The three cards answer three different leadership questions: how much faster, how many accounts finish on time, and what additional capacity is required. The third card keeps the resource tradeoff visible beside the benefits. The calculations remain traceable to the report: (15 − 9) ÷ 15 = 40%; 85% − 60% = 25 percentage points; (3 − 2) ÷ 2 = 50%.
The request specifies the decision maker, amount, deadline, and scope. Its budget comes from the same evidence: 80 accounts × 1 additional support hour × $75 = $6,000. This is incremental funding, not the total cost of onboarding. The owner, review date, and thresholds define what happens after approval.
The full process description can go in speaker notes. Keep the group size and comparison limitation on the slide because they affect how leaders interpret the results.
An executive summary slide is usually the first or most-referenced slide in a presentation. It has to do more than summarize. It needs to create confidence quickly.
The best version answers four questions:
If a slide only lists report sections, it becomes a table of contents. If it only lists conclusions, it may feel unsupported. The goal is the middle ground: a compact argument that helps the audience act.
Before writing the slide, skim the PDF for decisions rather than details. Long reports often contain background, methodology, appendices, repeated evidence, and secondary findings. Those parts matter, but they do not all deserve space on the executive summary slide.
Look for the parts of the PDF that carry the decision:
A useful habit is to write a one-sentence answer before designing anything: "This report shows that [finding], so we should [recommended action] because [evidence]." That sentence may not appear word for word on the slide, but it gives the summary a spine.
Once you know the main decision, reduce the report into a simple slide storyline. Most executive summary slides can follow this pattern:
For example, a weak headline might be "Q3 market research summary." A stronger executive headline would be "Enterprise buyers are prioritizing integration readiness over feature depth." The second version tells leaders what the report means before they inspect the details.
This storyline also keeps the slide from becoming a crowded digest. If a detail does not support the headline, the evidence, or the next step, it belongs in the speaker notes or an appendix slide.
Upload the PDF file to SlidesPilot and create a structured presentation you can refine.
Create Slides from PDFChoose the layout around the decision the reader needs to make. The same report can support different visual arrangements, but its numbers and qualifications should stay consistent.
| Layout | Choose it when | What goes where | Applied to the onboarding report |
|---|---|---|---|
| Three evidence cards + decision bar | A recommendation depends on several distinct proof points | Conclusion across the top; three parallel evidence cards in the middle; approval request at the bottom | Use the finished slide above: speed, completion rate, and support demand, followed by the $6,000 request |
| Before-and-after comparison + request panel | The reader needs to compare the same measures across two periods or groups | Conclusion at the top; baseline and pilot columns on the left; implication and request on the right | Compare 15 vs. 9 days, 60% vs. 85%, and 2 vs. 3 hours per account; keep each metric in its own row and retain the group-size note |
| Risk → evidence → mitigation | Approval depends primarily on a constraint or resource gap | Constraint in the headline; quantified exposure and evidence in the center; mitigation, owner, and deadline below | Lead with “The October pilot extension needs 80 additional support hours”; show the 80-account scope and 1-hour increase, then request $6,000 by September 25 |
For this report, the three-card layout is the clearest starting point: it gives the two benefits and the capacity tradeoff equal visibility before asking for approval. Choose the comparison layout if the meeting centers on validating the change; choose the risk layout if support capacity is the main unresolved decision.
The headline is the most important part of the executive summary slide. It should make a claim. If the audience reads only the headline, they should know the main message.
Good executive-summary headlines often use one of these shapes:
Each headline gives the audience a point of view. It also makes the rest of the slide easier to edit because every supporting point can be tested against the claim.
Avoid headlines that only name the document, such as "Annual report summary" or "Key findings." Those labels tell people where the material came from, but not what they need to know.
A long PDF can make every detail feel important. The executive summary slide should use the smallest amount of evidence needed to make the recommendation believable.
Choose evidence that is clear, relevant, and easy to explain aloud. A single chart, a short comparison, or three carefully chosen bullets can be stronger than a dense grid of copied findings. If the PDF contains several supporting charts, choose the one that most directly supports the headline and move the rest into backup slides.
When you rewrite evidence from the report, keep the meaning precise but make the language presentation-ready. Report language is often written for documentation. Slide language should be written for scanning.
For example:
The second version is easier to read, easier to defend, and more likely to survive the meeting.
Executives often read the slide before the presenter starts speaking. Make the structure obvious at a glance.
A practical layout is to place the headline across the top, use the center for the main evidence, and reserve the bottom or right side for implications and next steps. Keep each section visually distinct. If the slide has three evidence points, make them parallel in length and shape so the audience can compare them quickly.
Use hierarchy deliberately:
The slide should not look like a PDF page squeezed into a presentation. It should look like a decision aid created from the PDF. Storytelling with Data suggests treating the executive summary as a scannable one- or two-page overview, using a clear takeaway title, story structure, discernible sections, and complete sentences so readers can understand the main message without reading the full deck.
If you are starting from a long PDF report, SlidesPilot can help turn the source material into a structured, editable presentation. Instead of copying sections manually, you can upload the PDF, generate a deck, and then refine the executive summary slide around the decision you want to communicate.
This is especially useful when the report contains many sections and the presentation needs a clear story. SlidesPilot can identify key ideas, organize them into presentation-ready content, and apply a professional visual direction. You can then review the generated slides, edit the message, adjust the layout, export the presentation, or continue shaping it for PowerPoint or Google Slides. Customize the headline, supporting evidence, and decision request for your audience.
Before the executive summary slide goes into the final deck, read it as if you have only 30 seconds before the meeting moves on.
Check that the slide passes these tests:
If any part fails, remove detail before adding more. The strongest executive summary slides usually feel calm because the thinking has already been done.
Creating an executive summary slide from a long PDF report is a judgment exercise. The slide should not prove that you read every page. It should prove that you found the decision hiding inside the document.
Start with the main recommendation, select only the evidence that supports it, and design the slide so the argument is easy to scan. When you need to move quickly from source material to presentation, SlidesPilot gives you a structured first draft you can refine into a focused executive summary deck.
Turn reports, papers, and documents into clear, structured, editable PowerPoint presentations with AI.
Paste text, add a YouTube or webpage link, or upload a document to create a beautiful, structured summary connected to the source.
Transform detailed reports into professional PowerPoint presentations
Turn a research paper into a clear, editable PowerPoint covering the question, methods, results, limitations, and citations.
Upload a report to SlidesPilot and turn dense source material into a structured, editable presentation.

