AI Venn Diagram Generator
Turn Any Text into a Venn Infographic
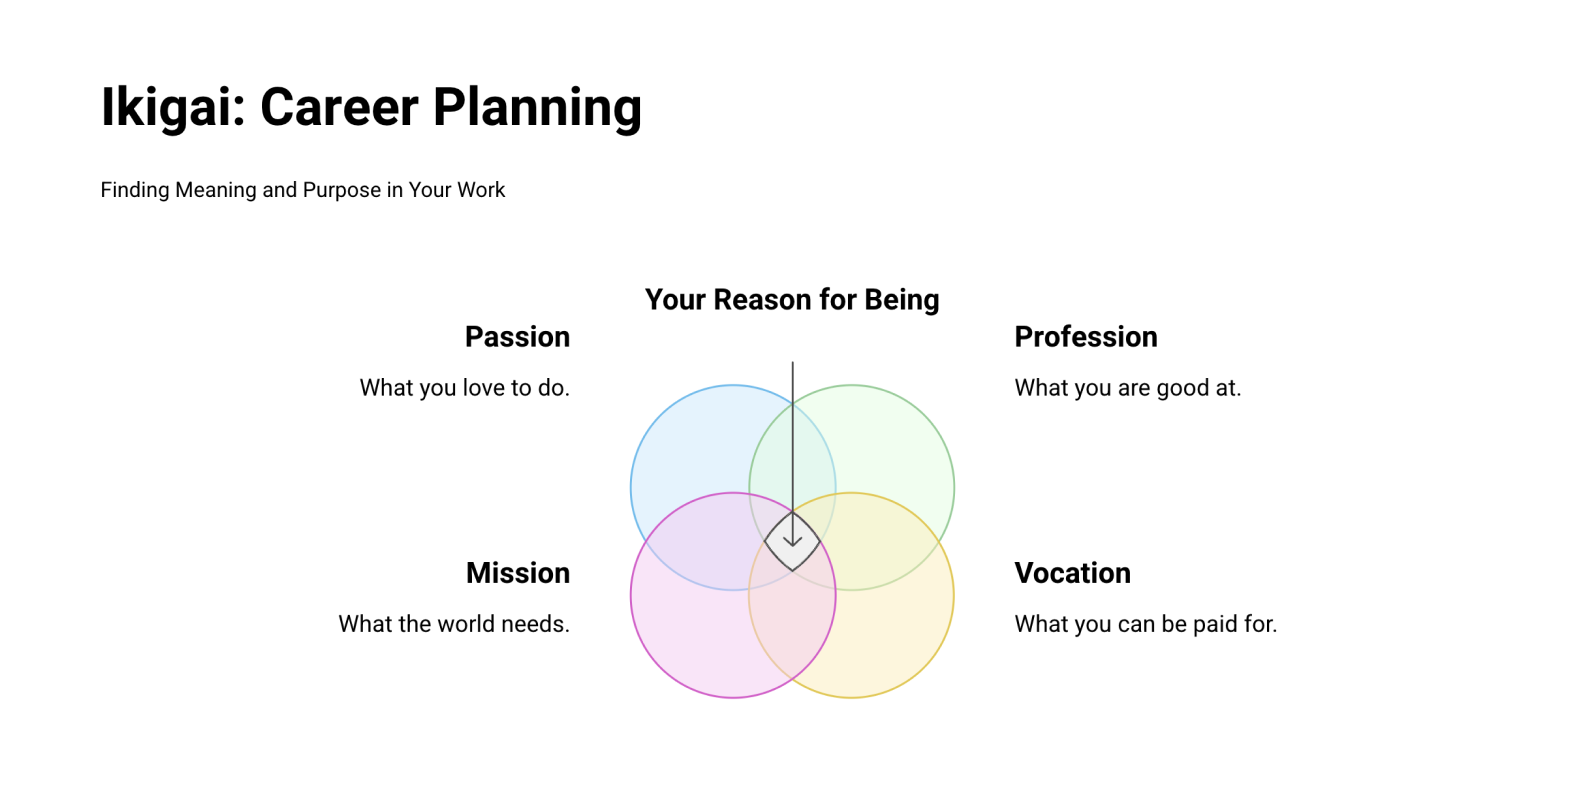
What is Venn Diagram Infographic?
A Venn diagram uses overlapping circles to show relationships between groups or concepts. The AI-powered Venn diagram infographic highlights shared and unique characteristics.
Generate Visuals Based on Your Text
Step-by-Step Guide How to Make a Venn Infographic with AI
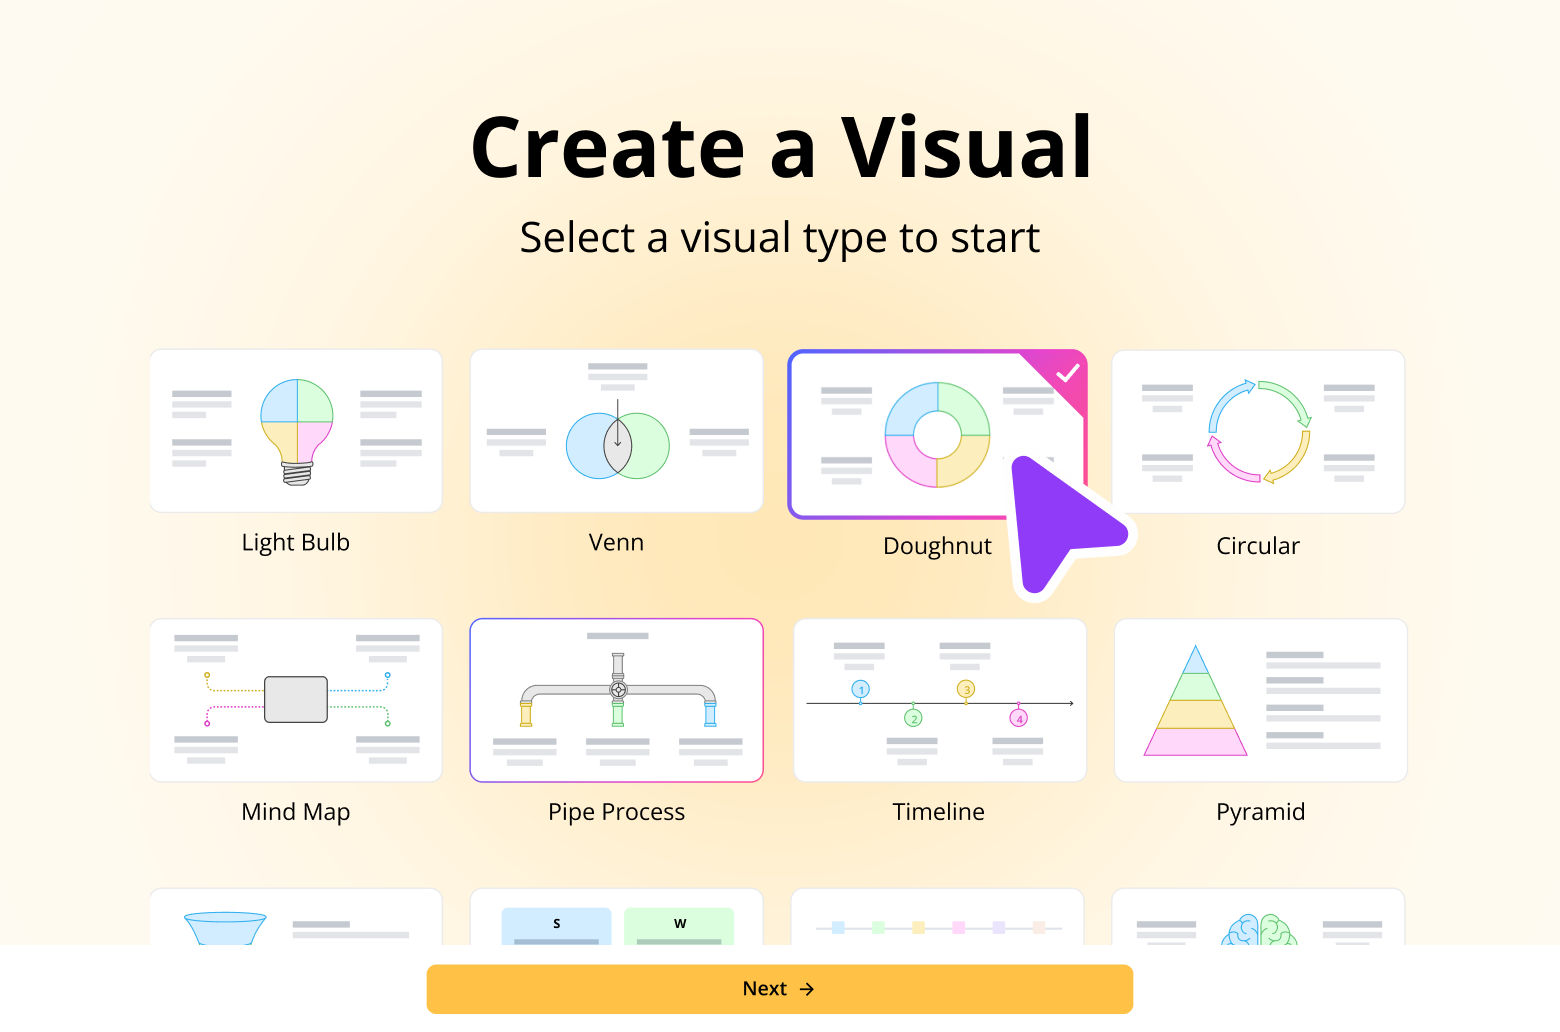
Step 1
Click "New Visual" and select Venn visual from the gallery.
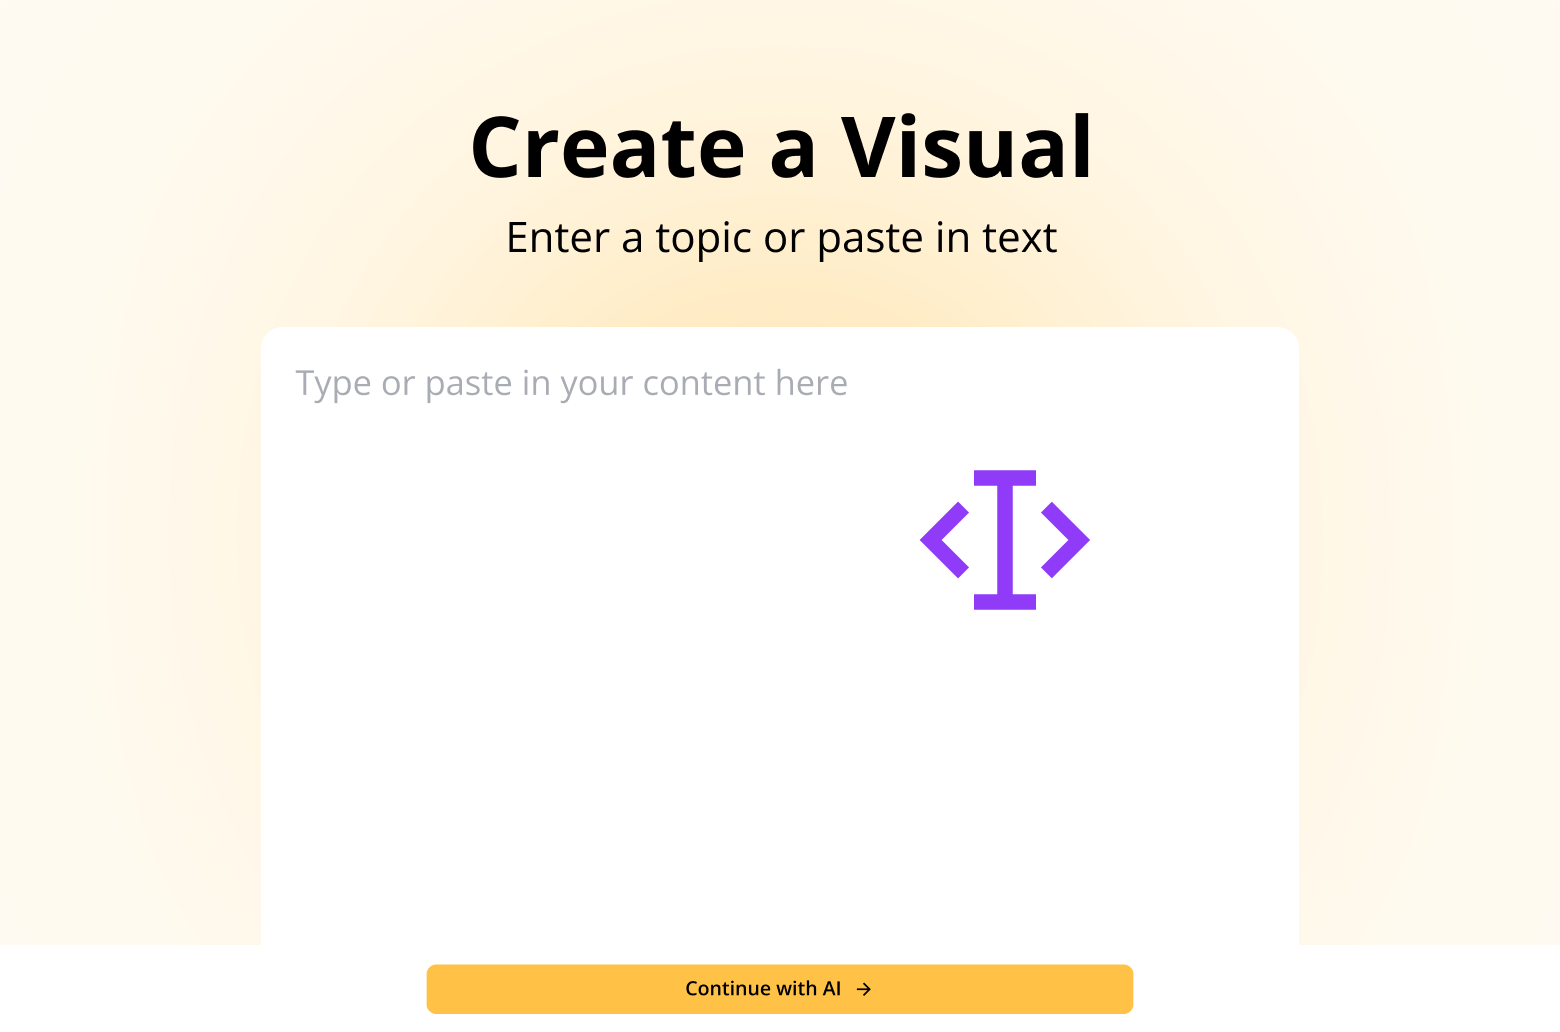
Step 2
Simply enter a topic for AI-generated content, or paste your own text.
Step 3
Relax and Watch the Magic Happen! Let AI supercharge your ideas into a polished Venn infographic - instantly organized and visually stunning!
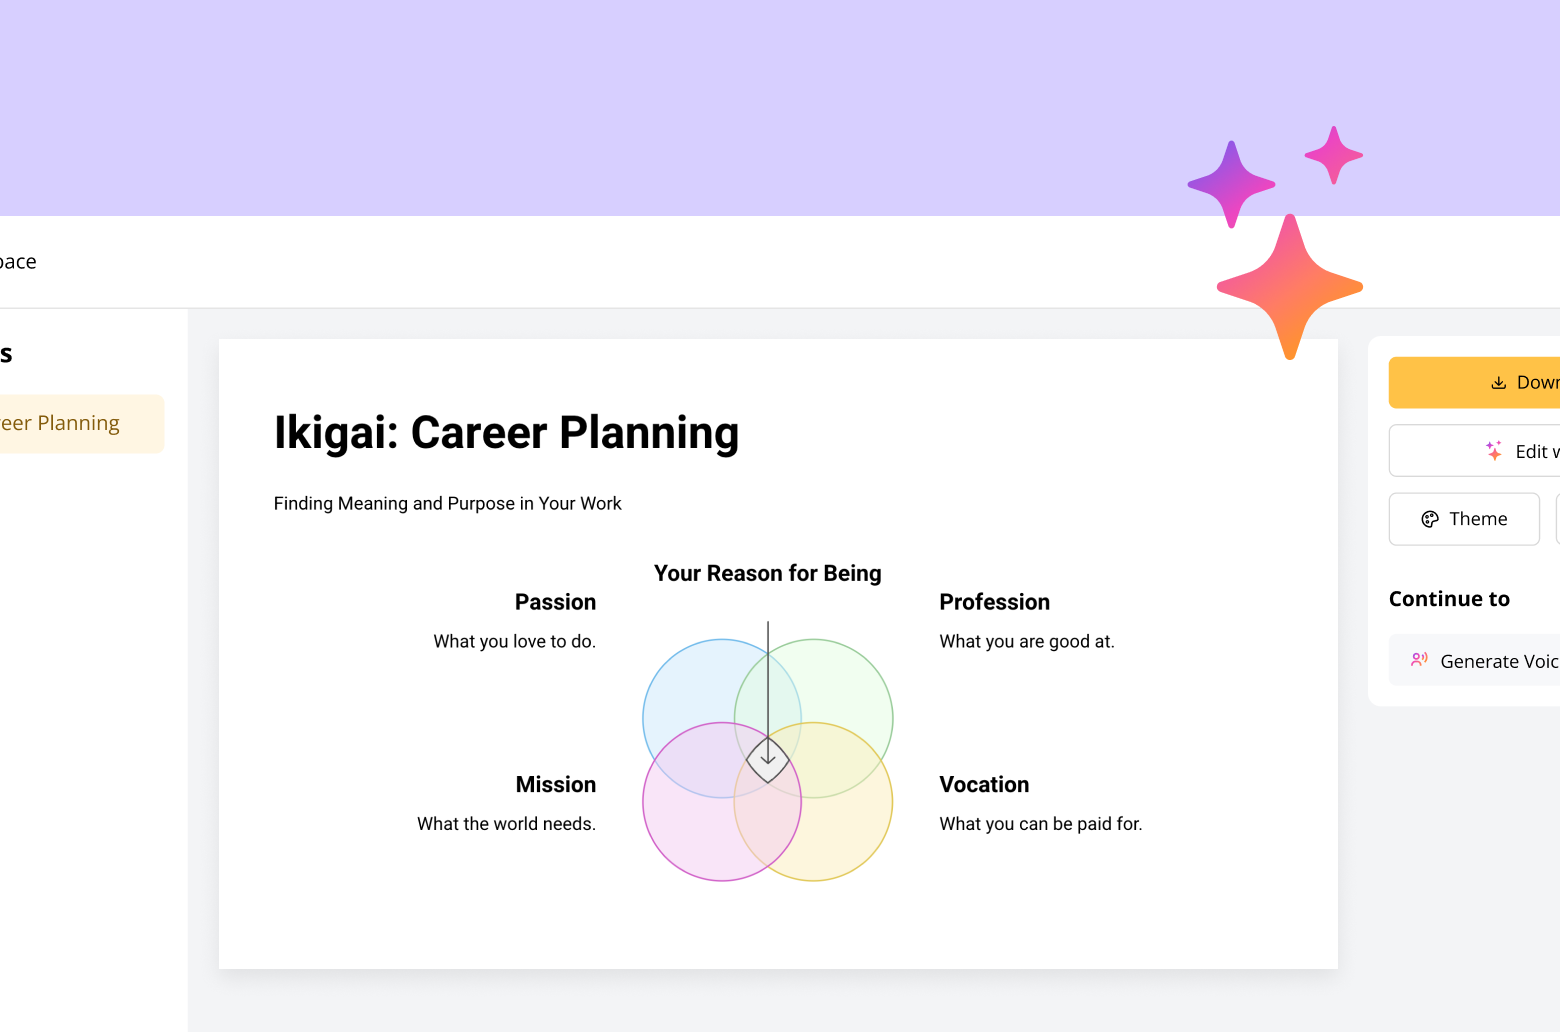
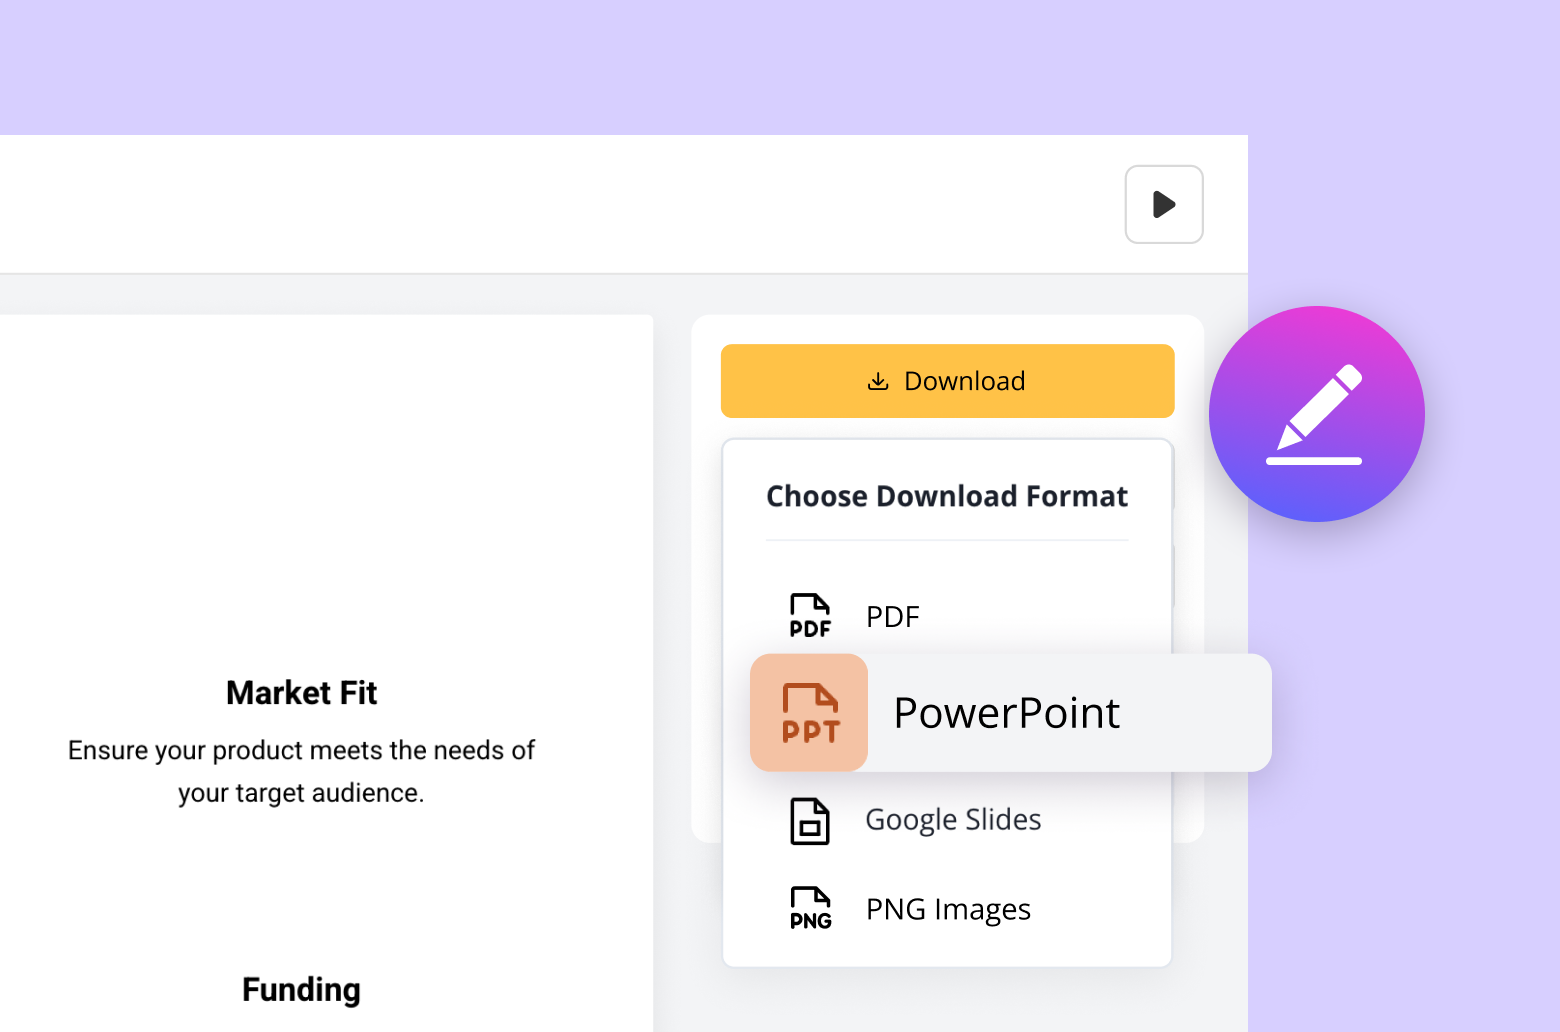
Step 4
Download your Venn infographic as PDF or PNG files, or export directly to PowerPoint and Google Slides for easy editing and customization.
Superfast
presentation creation
Join 1 million professionals, students, and educators

Create with AI
Convert to PPT with AI
Compatible with PowerPoint
Built in templates
Auto Layout
Copyright ©2026 SlidesPilot All rights reserved