Good informative speech topics give an audience one clear thing to understand: how a familiar technology works, why a natural phenomenon happens, or what an old object reveals about its time. A focused question gives you a stronger starting point than a broad subject such as “technology” or “the environment.”
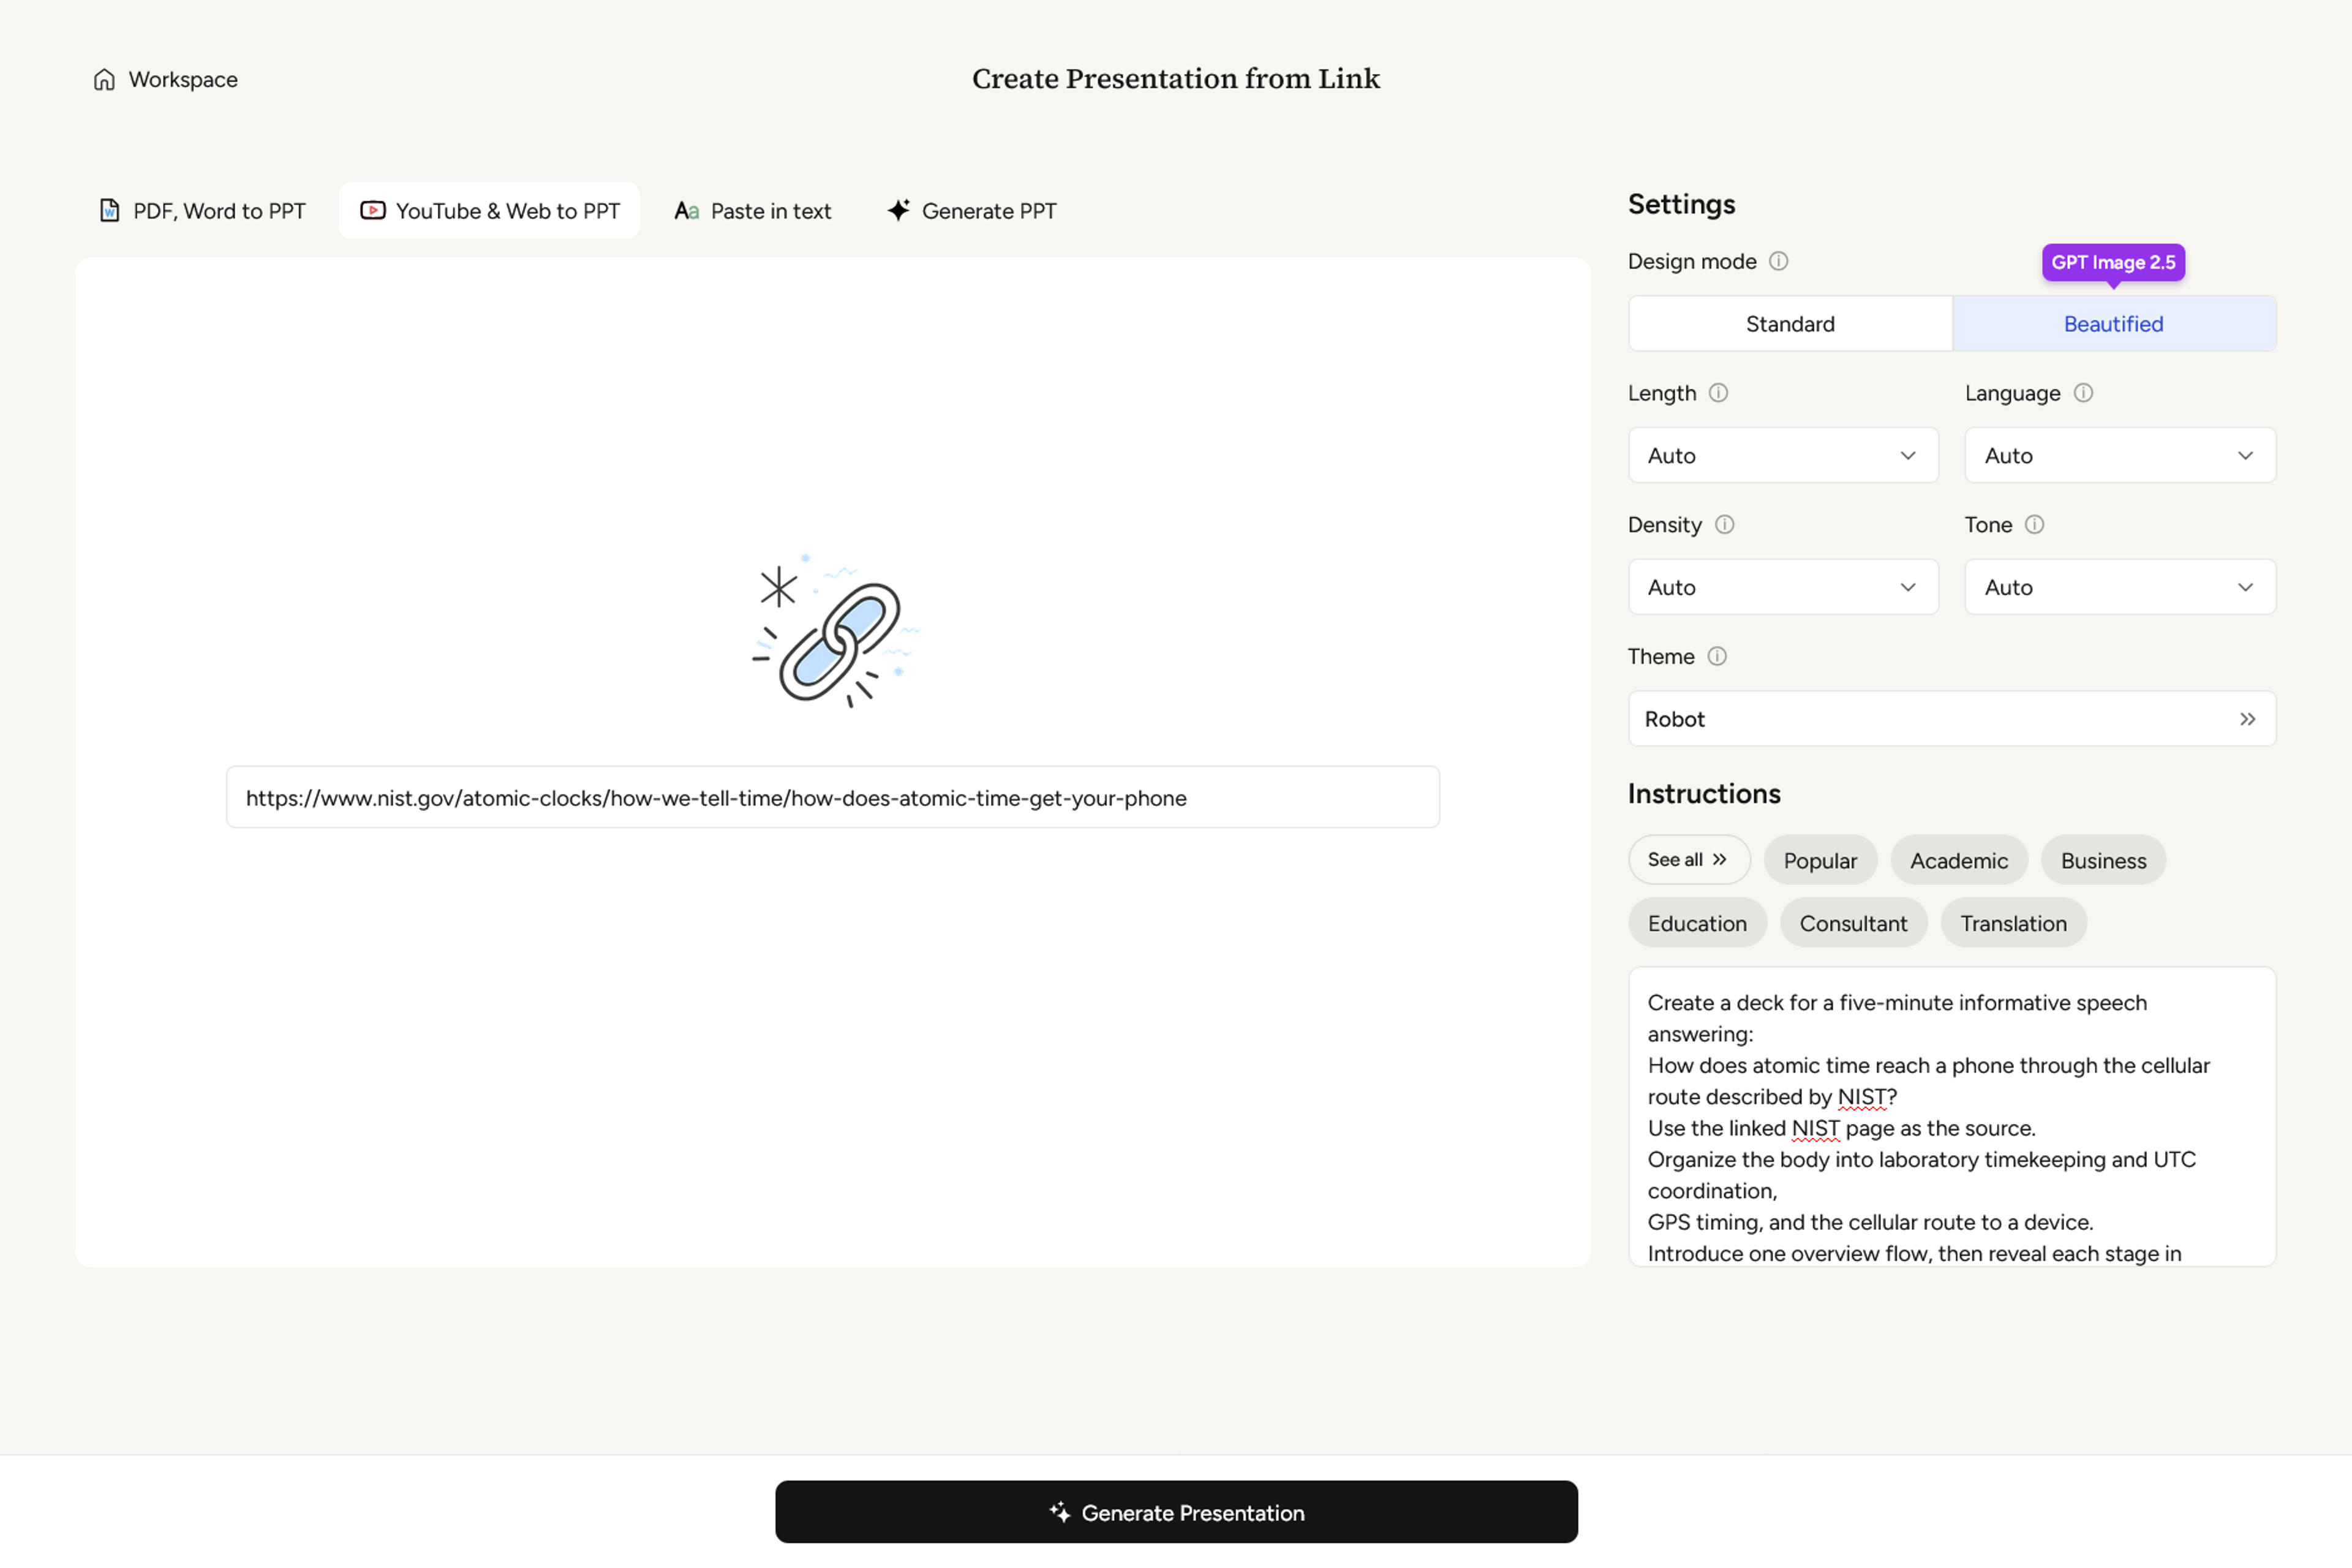
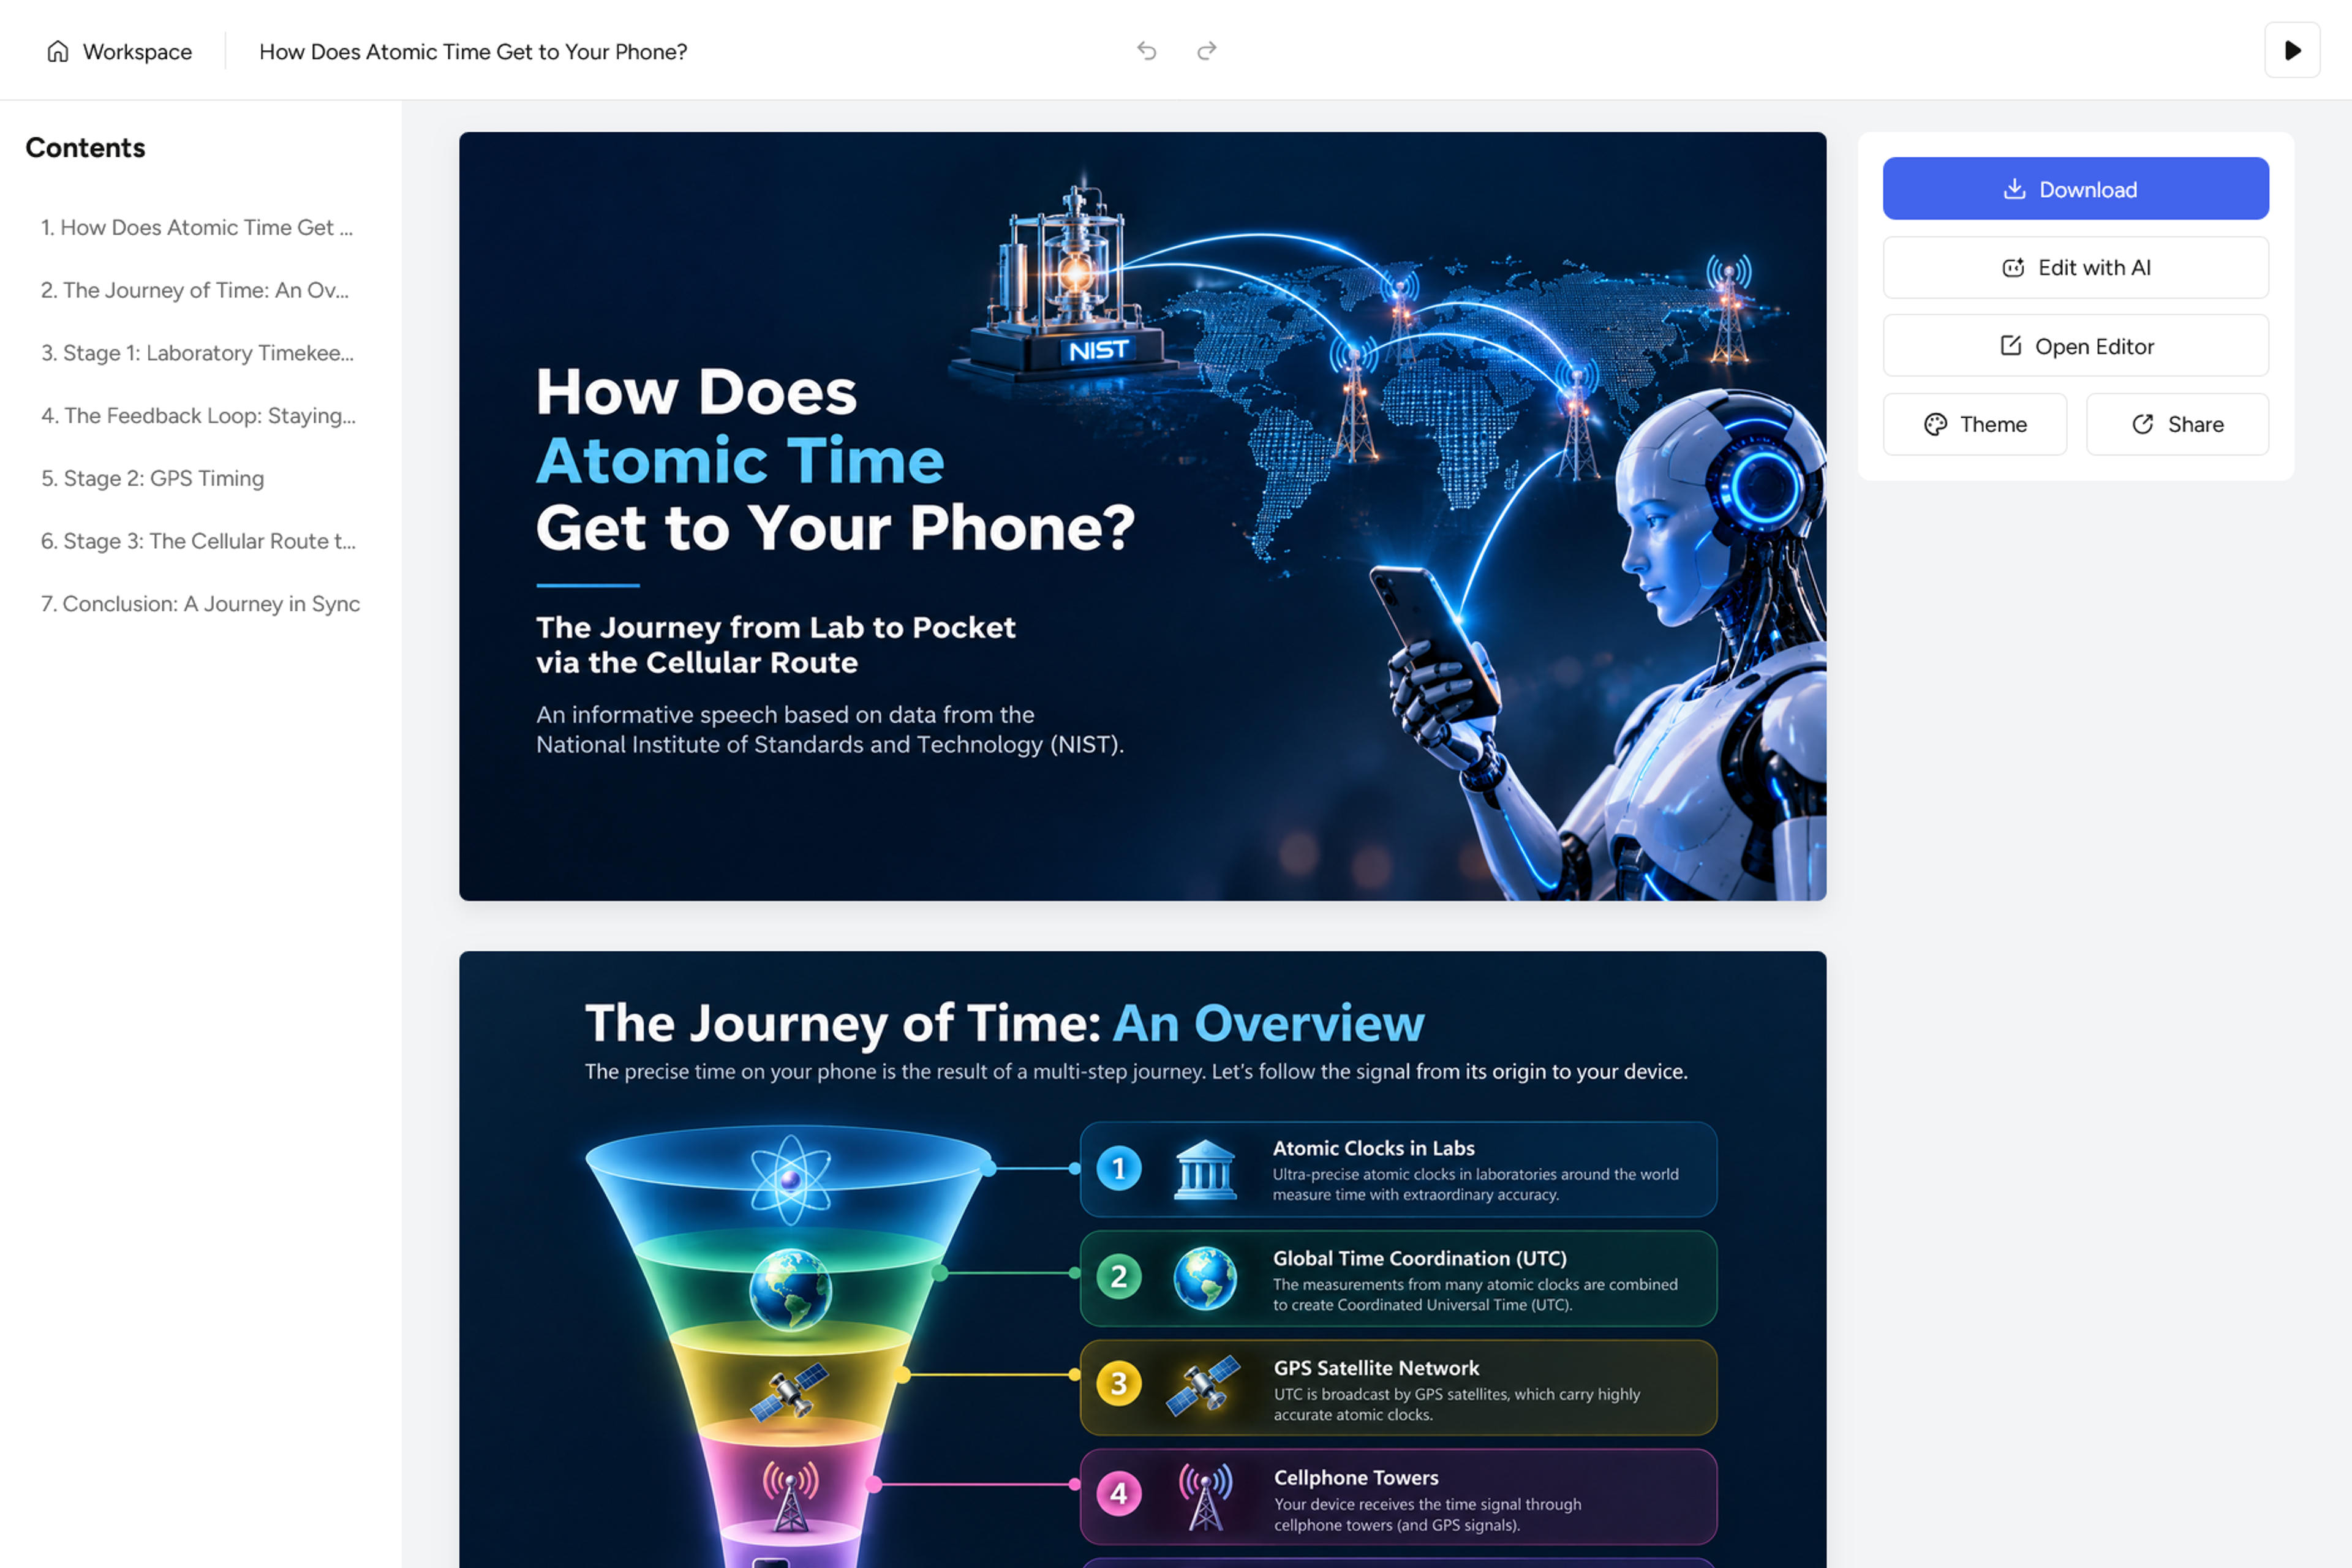
This guide offers 12 interesting ideas with bounded research questions, credible source starting points, three-point outlines, and visual suggestions. A worked example then shows how to turn a NIST webpage into an AI-generated speech deck, with screenshots of the generation setup and finished slides.
For a first classroom speech, start with Moon phases if you enjoy demonstrations, QR codes if you want an everyday technology hook, or historical photographs if you prefer objects and stories. Each gives you something concrete to show while you explain.
How to choose informative speech topics you can actually cover
An informative speech explains a subject so listeners understand it. Keep the central question explanatory: “How do urban surfaces affect temperature?” gives you a clearer informational task than “Why our city must ban dark roofs.”
Use this narrowing formula:
One subject + one process or comparison + one boundary.
For example, turn “earthquakes” into “How magnitude differs from shaking intensity in reports of one earthquake.” The boundary might be one event, one object, one place, or one mechanism. You can then organize the body around three questions the audience naturally asks next.
Before committing, check three things:
- Audience fit: Can you explain why the question matters without a long technical introduction?
- Research access: Can you find a source that explains the mechanism and another source or concrete example that helps you illustrate it?
- Time fit: Can you answer the question in three main points and rehearse the full speech within the assigned time?
For a five-minute assignment, plan a small explanation with an opening, three connected points, and a closing answer. Treat slide count as a design choice; the time limit belongs to the speech.
Science and nature: explain something people have seen
1. Why the ocean can look blue, green, or brown
Bounded research question: How do light absorption and suspended particles help explain differences in ocean color?
Source starting point: NOAA’s explanation of ocean color. Look for its distinction between water absorbing red wavelengths and particles influencing the colors we see.
Three-point outline:
- Introduce sunlight as a mixture of colors.
- Explain how water absorbs parts of that light.
- Show how sediment and other particles change the appearance.
Visual idea: Pair two credited ocean photographs with a simple light-filter diagram. Present the photographs as illustrations unless their accompanying records establish the cause of their color.
2. Why the Moon changes shape during the month
Bounded research question: How does our viewing angle change the illuminated portion of the Moon we see?
Source starting point: NASA’s Moon phases guide, particularly its explanation of reflected sunlight and the illuminated half.
Three-point outline:
- Establish where moonlight comes from.
- Explain the changing Sun–Earth–Moon geometry.
- Connect that geometry to crescent, quarter, and full phases.
Visual idea: Use a lamp and ball, or a diagram pairing an overhead view with the view from Earth. Keep the light direction consistent.
3. Why one earthquake has different shaking intensities
Bounded research question: How do magnitude and intensity describe different aspects of the same earthquake?
Source starting point: The USGS guide to earthquake magnitude, energy release, and shaking intensity. Use a documented event map as a second source if you add a case study.
Three-point outline:
- Define magnitude as a measure of the earthquake’s size.
- Explain intensity as shaking and effects at a location.
- Read one event’s intensity map without treating its colors as separate magnitudes.
Visual idea: Put an event’s reported magnitude beside its credited shaking-intensity map. Preserve the map’s legend and event date.
Everyday technology: reveal a hidden process
4. How atomic time reaches a phone
Bounded research question: What is the cellular timing route from laboratory clocks to a phone described by NIST?
Source starting point: NIST’s How Does Atomic Time Get to Your Phone?. Follow the sequence rather than collecting unrelated facts about atomic physics.
Three-point outline:
- Introduce laboratory clocks and the UTC time scale.
- Trace timing corrections and signals through the GPS system.
- Explain the cell-tower-to-device step in NIST’s example.
Visual idea: Draw a labeled route from clocks to satellites to a tower to a phone, with a separate callout for UTC coordination.
5. Why a damaged QR code can still scan
Bounded research question: How does error correction help a QR code recover encoded information after some damage?
Source starting point: DENSO WAVE’s QR code error-correction explanation. Research the tradeoff between error-correction level and data capacity.
Three-point outline:
- Introduce a QR code as encoded data.
- Explain the role of added error-correction information.
- Describe why recovery depends on the damage and encoding choices.
Visual idea: Show a clean code beside a deliberately altered copy you have tested. Label the demonstration’s conditions; do not turn a successful scan into a universal damage threshold.
6. What happens to a password after you create it
Bounded research question: What roles do a salt and a password hash play in a password-verification system?
Source starting point: The password-verifier section of NIST’s Digital Identity Guidelines. Focus on the storage mechanism rather than covering all account security.
Three-point outline:
- Describe the difference between a password and its stored hash.
- Introduce the salt as an additional input to password hashing.
- Explain how a later login can be checked using the stored information.
Visual idea: Draw a simplified password-plus-salt-to-hash flow using invented inputs. Label it conceptual rather than executable security code.
Places and resources: make a local question researchable
7. Why some urban spaces become hotter than others
Bounded research question: How do built surfaces and vegetation contribute to urban heat islands?
Source starting point: EPA’s What Are Heat Islands?. Separate its explanations of surface temperature and air temperature.
Three-point outline:
- Define a heat island and the comparison being made.
- Explain how surfaces and vegetation affect heating and cooling.
- Compare a shaded space and a paved space using clearly identified evidence.
Visual idea: Use an annotated streetscape. If adding thermal measurements, identify whether they measure surfaces or air, along with the location and time.
8. Where rainfall goes after it hits a parking lot
Bounded research question: How does replacing permeable ground with pavement change infiltration and surface runoff?
Source starting point: The USGS overview of urban infrastructure and water management. Follow its explanation of impervious surfaces and the movement of stormwater.
Three-point outline:
- Distinguish infiltration from surface runoff.
- Compare rain falling on vegetated ground and pavement.
- Trace one local drainage route using a municipal map or documented plan.
Visual idea: Draw two cross-sections under the same illustrated rainfall. Use qualitative arrows unless you have measured quantities for their widths.
9. How EPA compares different destinations for wasted food
Bounded research question: What distinguishes prevention, donation, composting, and disposal in EPA’s Wasted Food Scale?
Source starting point: EPA’s Wasted Food Scale, including its stated environmental scope.
Three-point outline:
- Explain the difference between preventing waste and managing it afterward.
- Compare selected pathways shown in the scale.
- Trace an illustrative cafeteria surplus through those alternatives.
Visual idea: Build a branching process diagram. Label the cafeteria example hypothetical and keep environmental comparisons separate from local cost claims.
History and information: teach the audience how to look
10. What an old map reveals about its makers
Bounded research question: What do the labels, symbols, and omissions on one historical map suggest about its purpose and intended audience?
Source starting point: The Library of Congress guide to getting started with maps. Then select one digitized map and read its catalog record.
Three-point outline:
- Identify the map’s creator, date, place, and documented purpose.
- Examine two or three specific visual choices.
- Separate visible evidence from interpretations requiring more context.
Visual idea: Use a full-map view followed by two enlarged details. Keep the catalog identifier and source credit visible.
11. How archives protect historical photographs
Bounded research question: How do handling, enclosures, and storage conditions help preserve photographic prints?
Source starting point: The Library of Congress guidance on care, handling, and storage of photographs. Note its emphasis on identifying photographic materials.
Three-point outline:
- Introduce the print as a physical object with vulnerable materials.
- Explain handling and enclosure choices.
- Connect storage conditions to long-term care.
Visual idea: Show a print, a suitable enclosure, and a storage box as an annotated sequence. Use a reproduction for a handling demonstration.
12. How a histogram changes the story of a dataset
Bounded research question: How does changing bin width affect what an audience notices in the same small dataset?
Source starting point: The NIST Engineering Statistics Handbook’s histogram guide, which explains grouping numerical observations into bins.
Three-point outline:
- Introduce observations, intervals, and frequency.
- Plot the same values with two bin widths.
- Explain which apparent patterns depend on the display choice.
Visual idea: Put the histograms side by side with matching axis scales. Use a clearly labeled invented dataset so listeners can inspect every value.