


Turn scattered dates into a sequence
Paste a project brief, event plan, syllabus, or history notes and let AI pull milestones into a clean chronological flow.
Turn events, milestones, roadmap phases, project plans, and historical sequences into a slide-ready timeline.
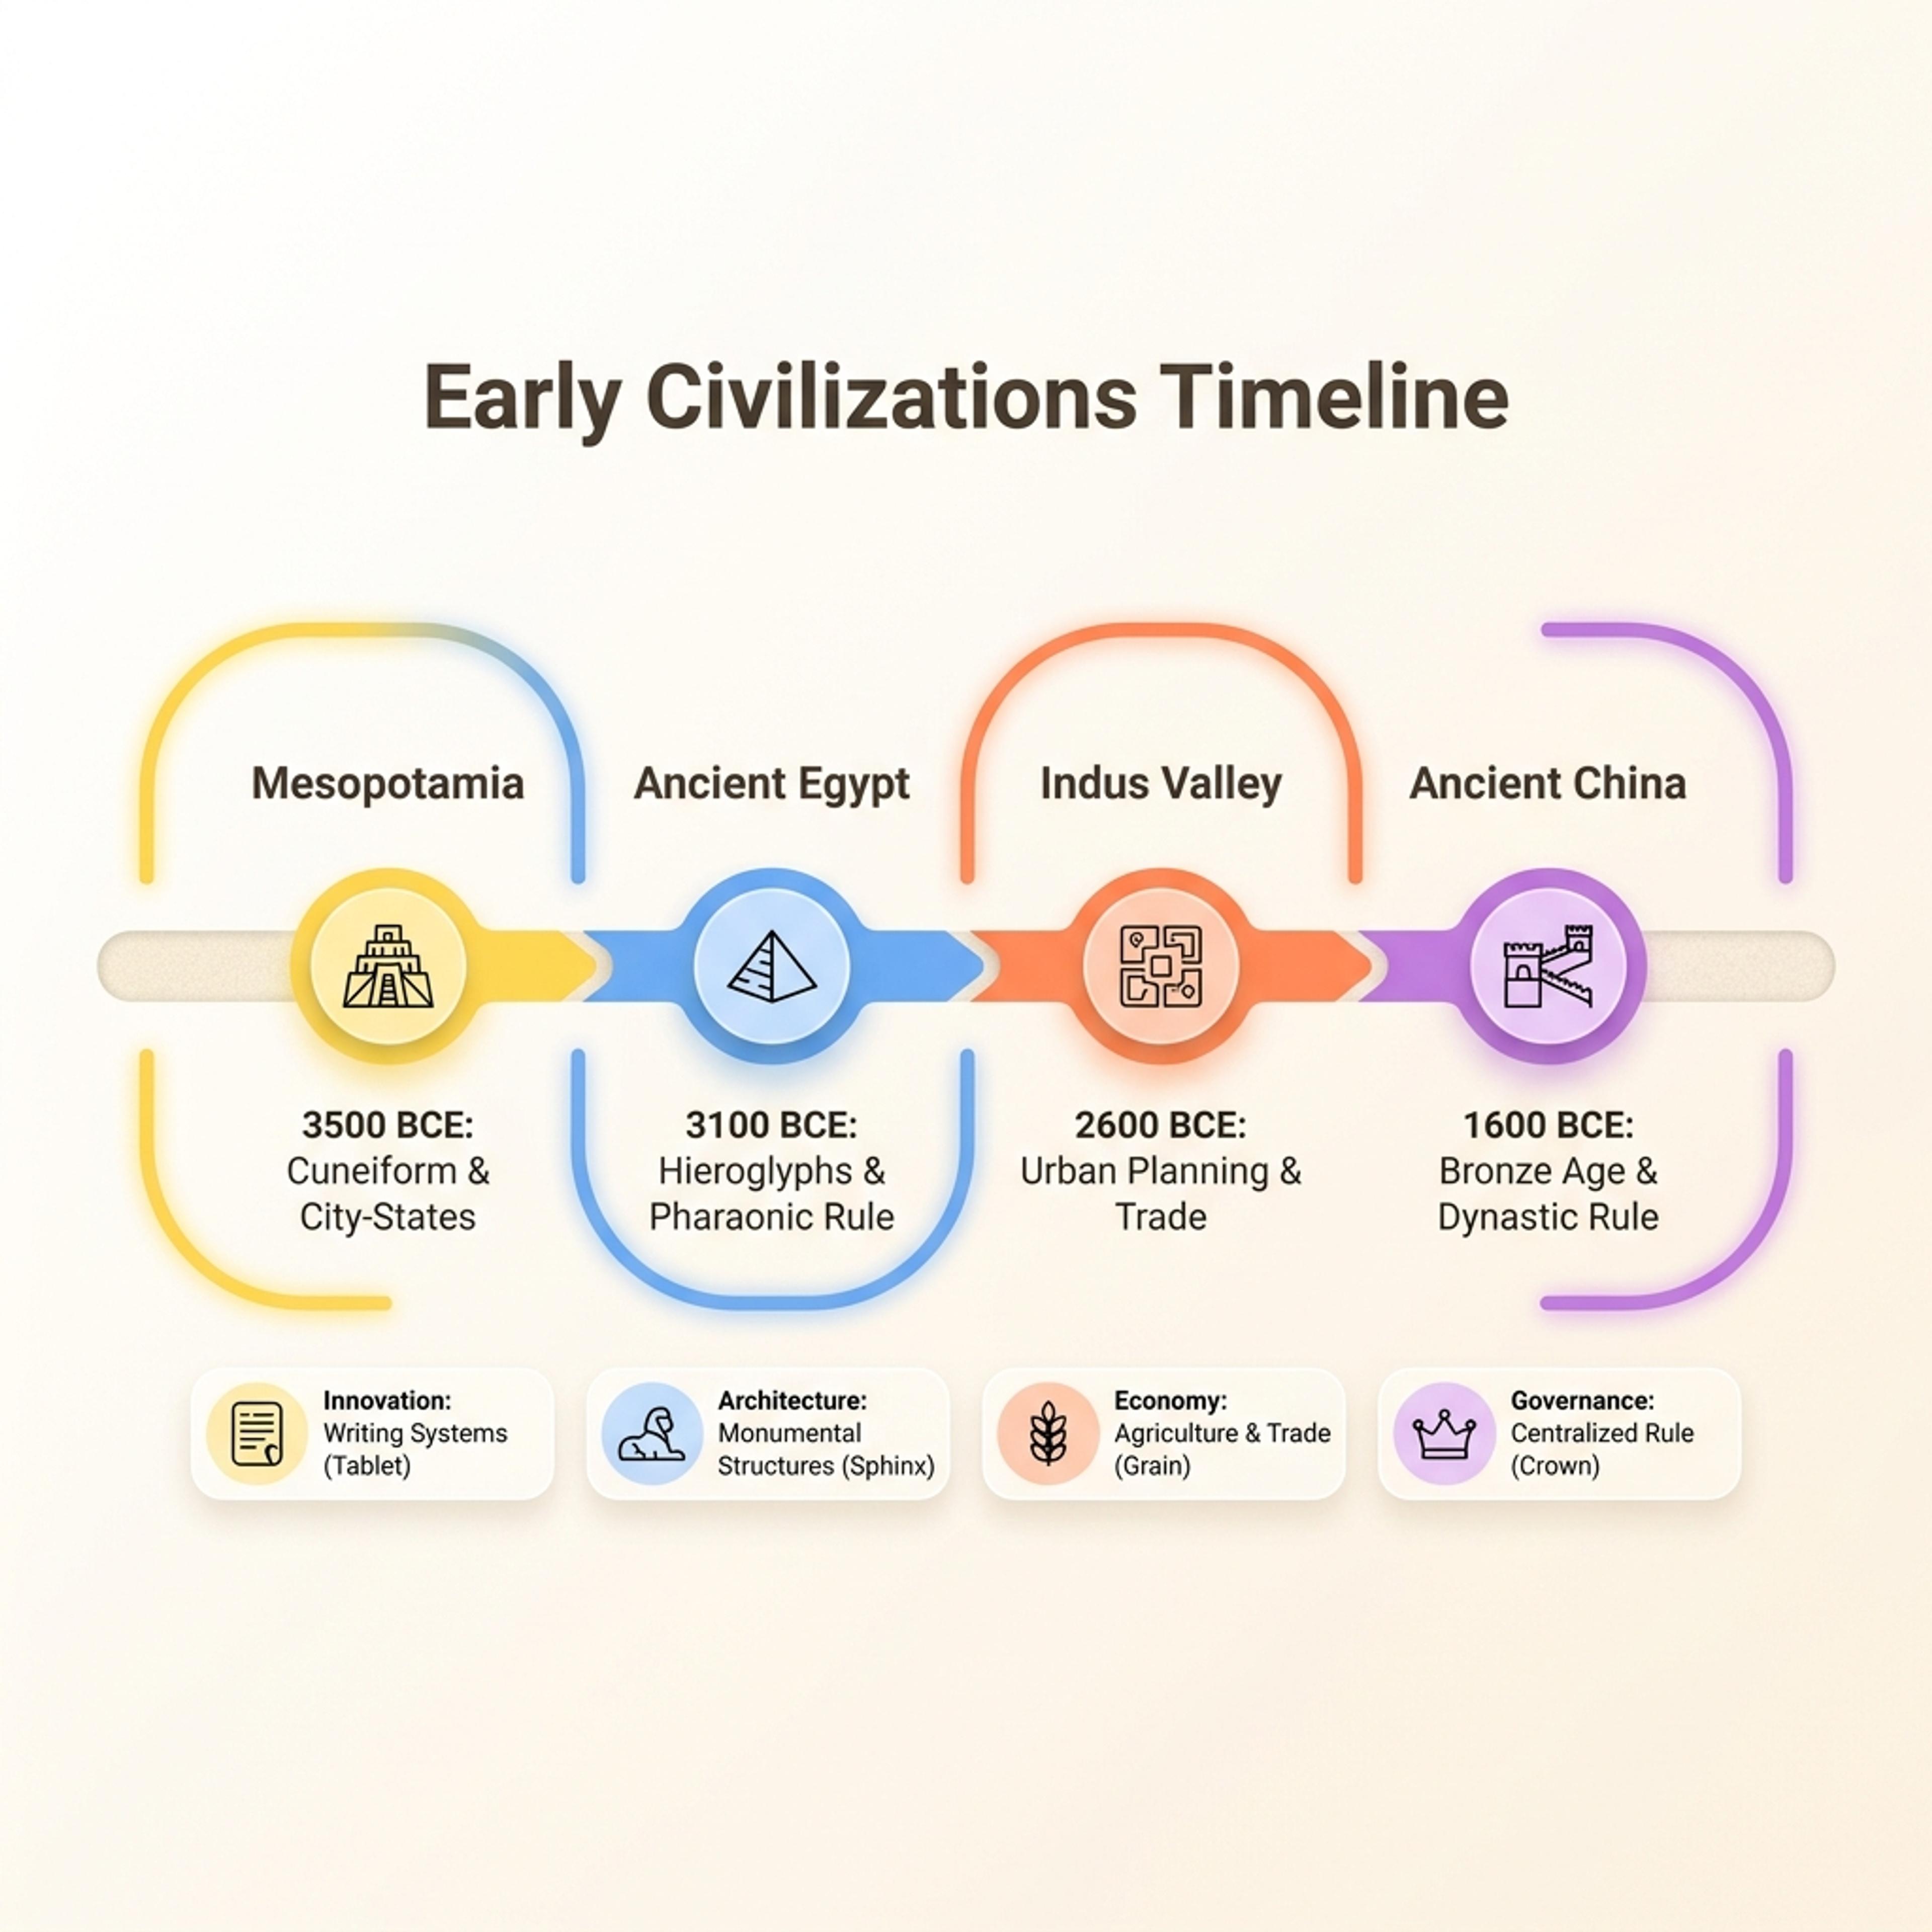
Drag & drop your file here or
A timeline shows how events unfold over time, so audiences can understand order, pacing, deadlines, and cause-and-effect without reading a long list.
Use a timeline when the order of events matters as much as the details themselves.
Paste a project brief, event plan, syllabus, or history notes and let AI pull milestones into a clean chronological flow.
Make it easier to see what happens first, what overlaps, and where handoffs or deadlines need attention.
Use the generated timeline in kickoff decks, launch reviews, classroom lessons, research methods, or client status updates.
Give SlidesPilot the sequence and context, then refine the milestones before presenting.
Paste dated notes, a project outline, a launch plan, or a historical sequence that needs to become a timeline.
Tell AI whether the timeline is for executives, students, clients, or teammates so the level of detail fits the slide.
Check dates, merge minor events, rename milestones, and keep only the moments that support the presentation story.
Use timeline visuals when events, milestones, deadlines, or project phases need to be understood in order.
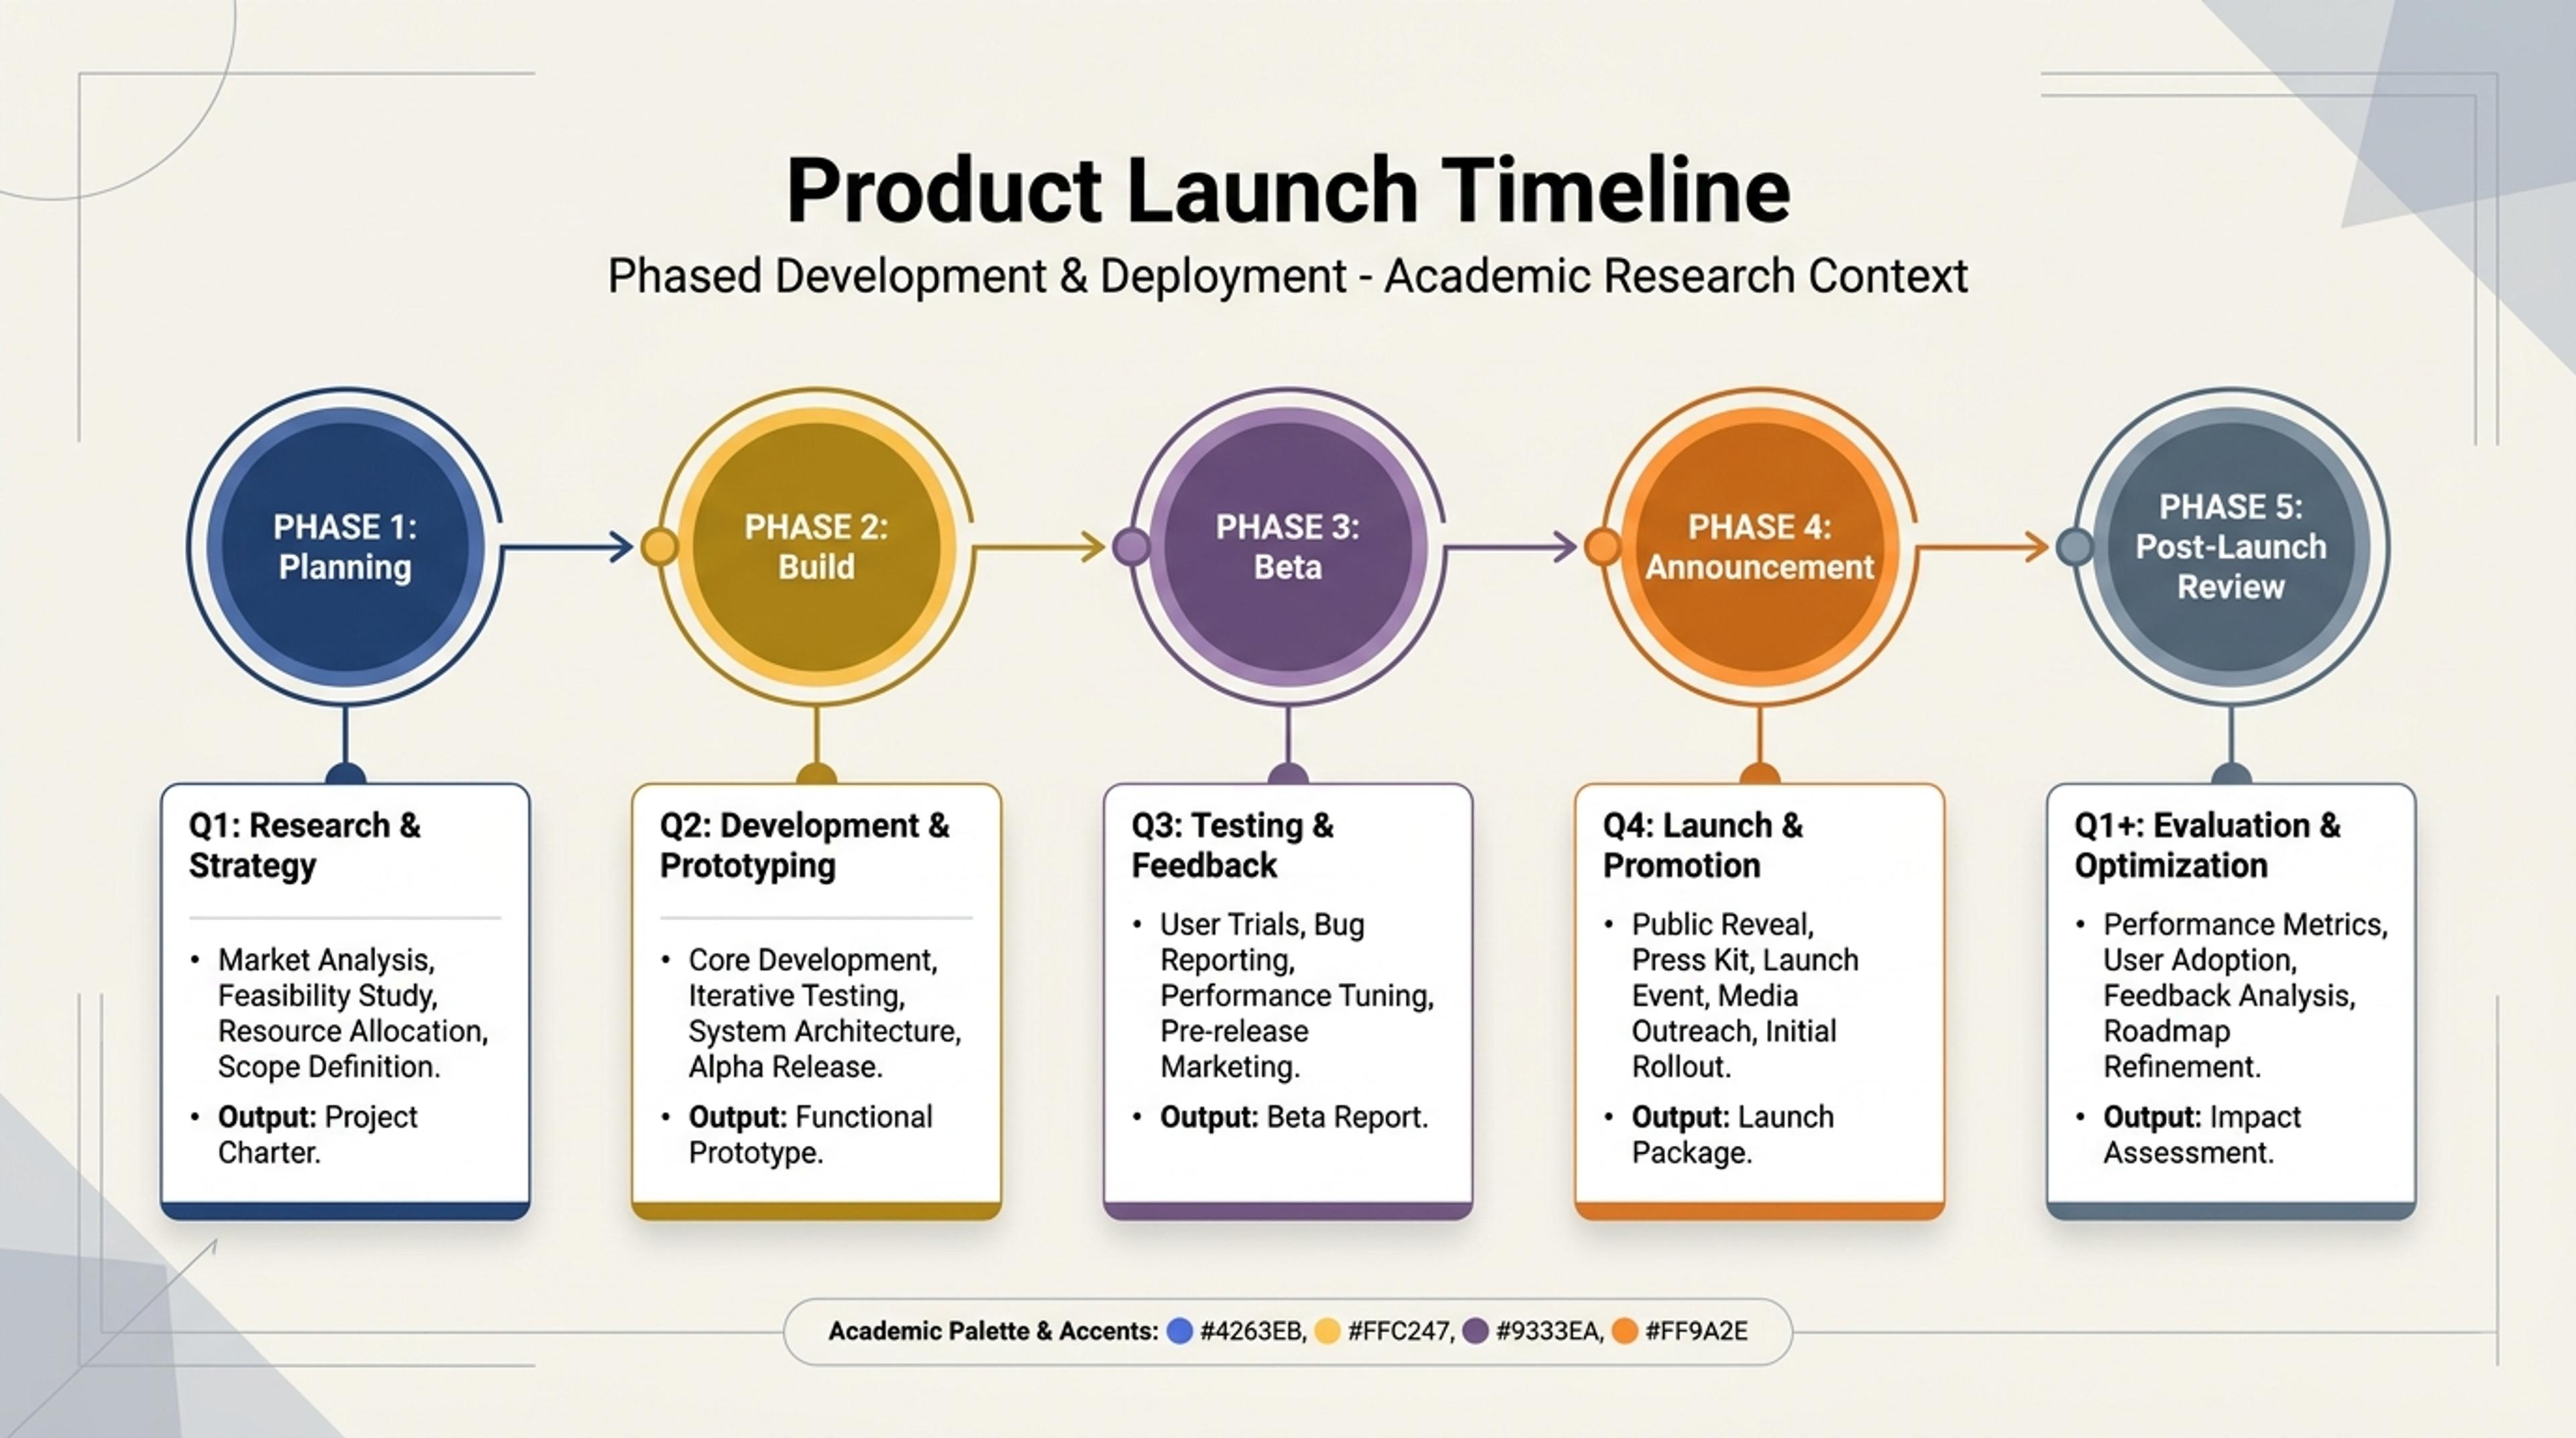
A milestone slide showing planning, build, beta, announcement, and post-launch review.
Provide the events, phases, deadlines, or milestones you already have. Dates help, but a rough order is enough for a first draft if you plan to edit the result.
Yes. You can turn planning notes, launch milestones, onboarding phases, or status updates into a timeline that is easier to present than a task list.
Yes. Timelines work well for historical events, curriculum overviews, study guides, and research methods because they make order and cause-and-effect easier to discuss.
Yes. You should review the generated milestones, correct dates, shorten labels, and remove details that do not belong on the slide.
Use a timeline when time order is the main point. Use a flowchart or process diagram when decisions, branches, or handoffs matter more than dates.
Use these formats when your timeline needs to become a process, funnel, cycle, or broader visual summary.
Turn topics, notes, documents, and links into editable visuals for slide decks, lessons, reports, and planning conversations.
Show linear workflows, handoffs, intake processes, and delivery stages as a clean pipe process diagram.
Show cycles, recurring workflows, feedback loops, and continuous improvement processes as a clear circular visual.
Turn a problem statement, notes, documents, or links into an editable Ishikawa diagram for root-cause analysis and PowerPoint.
Visualize conversion stages, selection processes, sales pipelines, recruiting steps, and drop-off points in a funnel chart.
Paste milestones, dates, or planning notes and turn them into a timeline you can edit before presenting.