


Start before the slide is designed
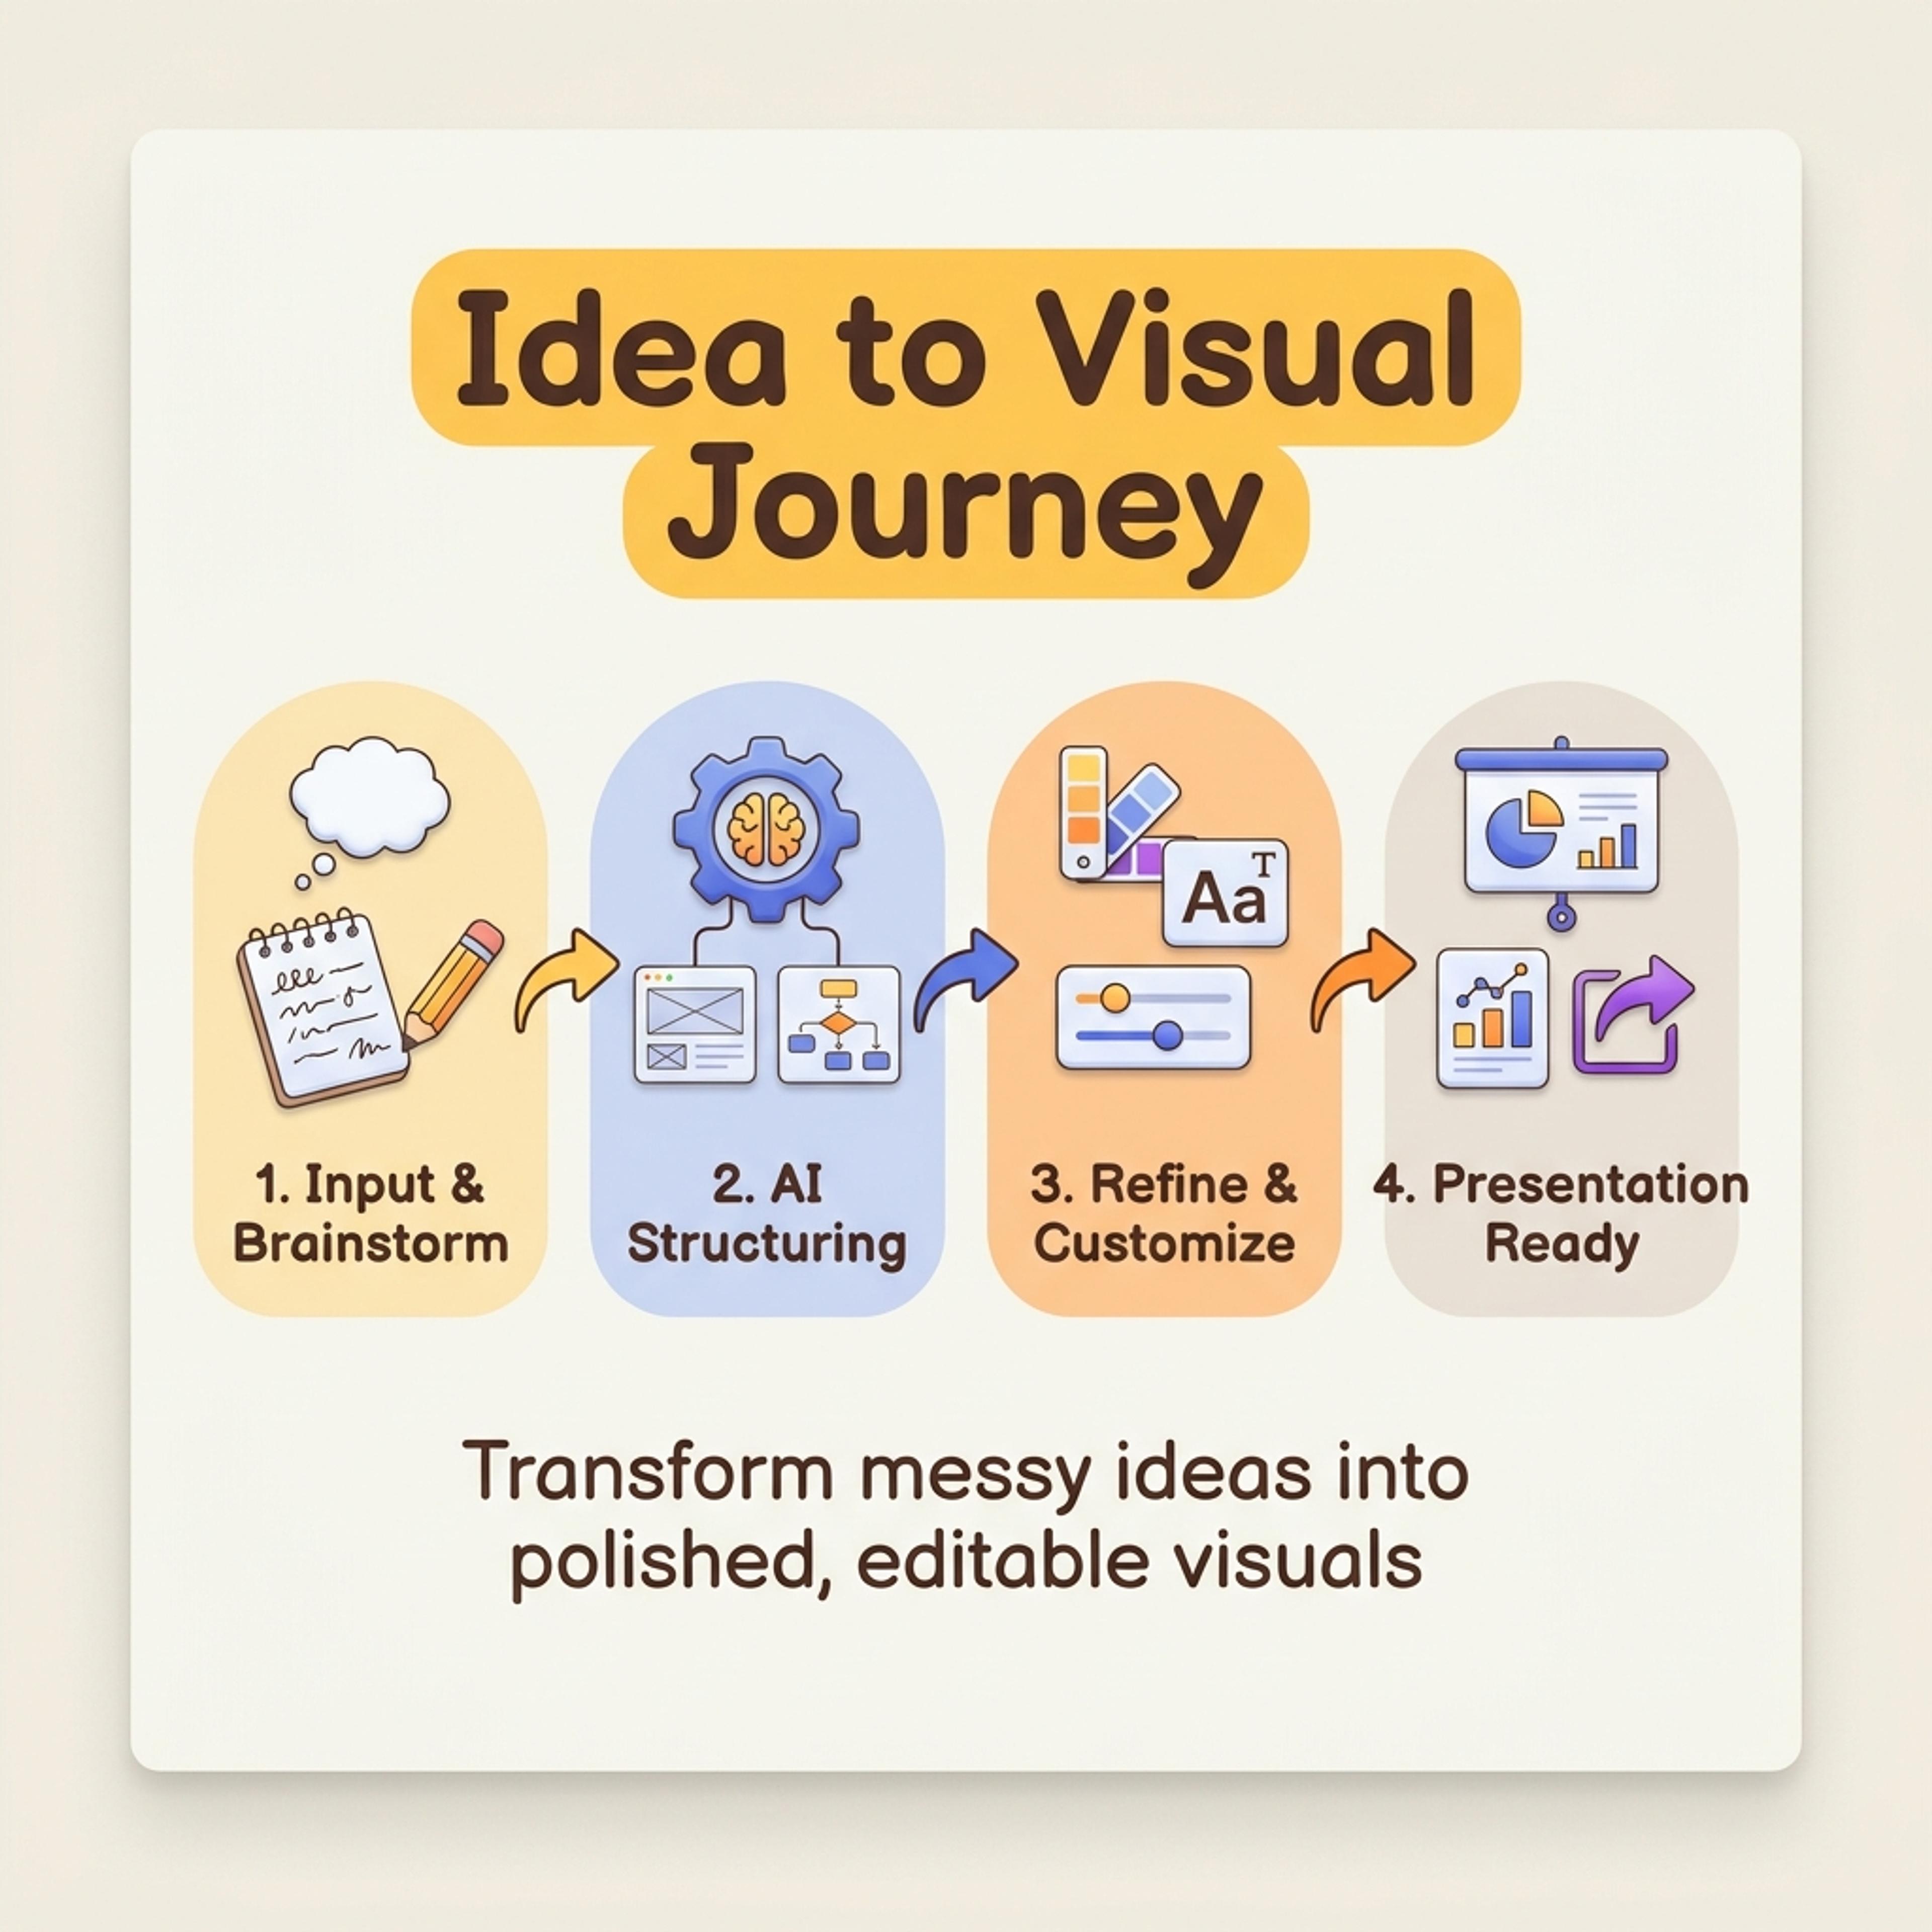
Paste a rough brief, meeting notes, lesson outline, or source link and let AI suggest the first visual structure instead of beginning with empty shapes.
Turn topics, notes, documents, and links into editable visuals for slide decks, lessons, reports, and planning conversations.
Drag & drop your file here or
SlidesPilot helps you move from raw information to a first visual draft: timelines, diagrams, charts, frameworks, and summaries that can be edited for a real presentation.
Use SlidesPilot when the idea is clear enough to explain, but not yet structured enough to present.
Paste a rough brief, meeting notes, lesson outline, or source link and let AI suggest the first visual structure instead of beginning with empty shapes.
Move toward a timeline, comparison, hierarchy, process, or map depending on what the audience needs to understand first.
Use the generated visual as a working draft, then revise the labels, emphasis, and wording before it goes into your deck.
Start with the idea you already have, then shape the generated draft into something you would actually present.
Write the topic, audience, and visual goal, such as a planning timeline, comparison, process, or one-slide summary.
Paste notes, upload a document, or add a link so the visual draft is based on your real context rather than a generic prompt.
Review the structure, rename sections, remove weak points, and keep the final slide aligned with the story of your deck.
Preview visual formats that can turn raw topics, notes, documents, or links into clearer slides.
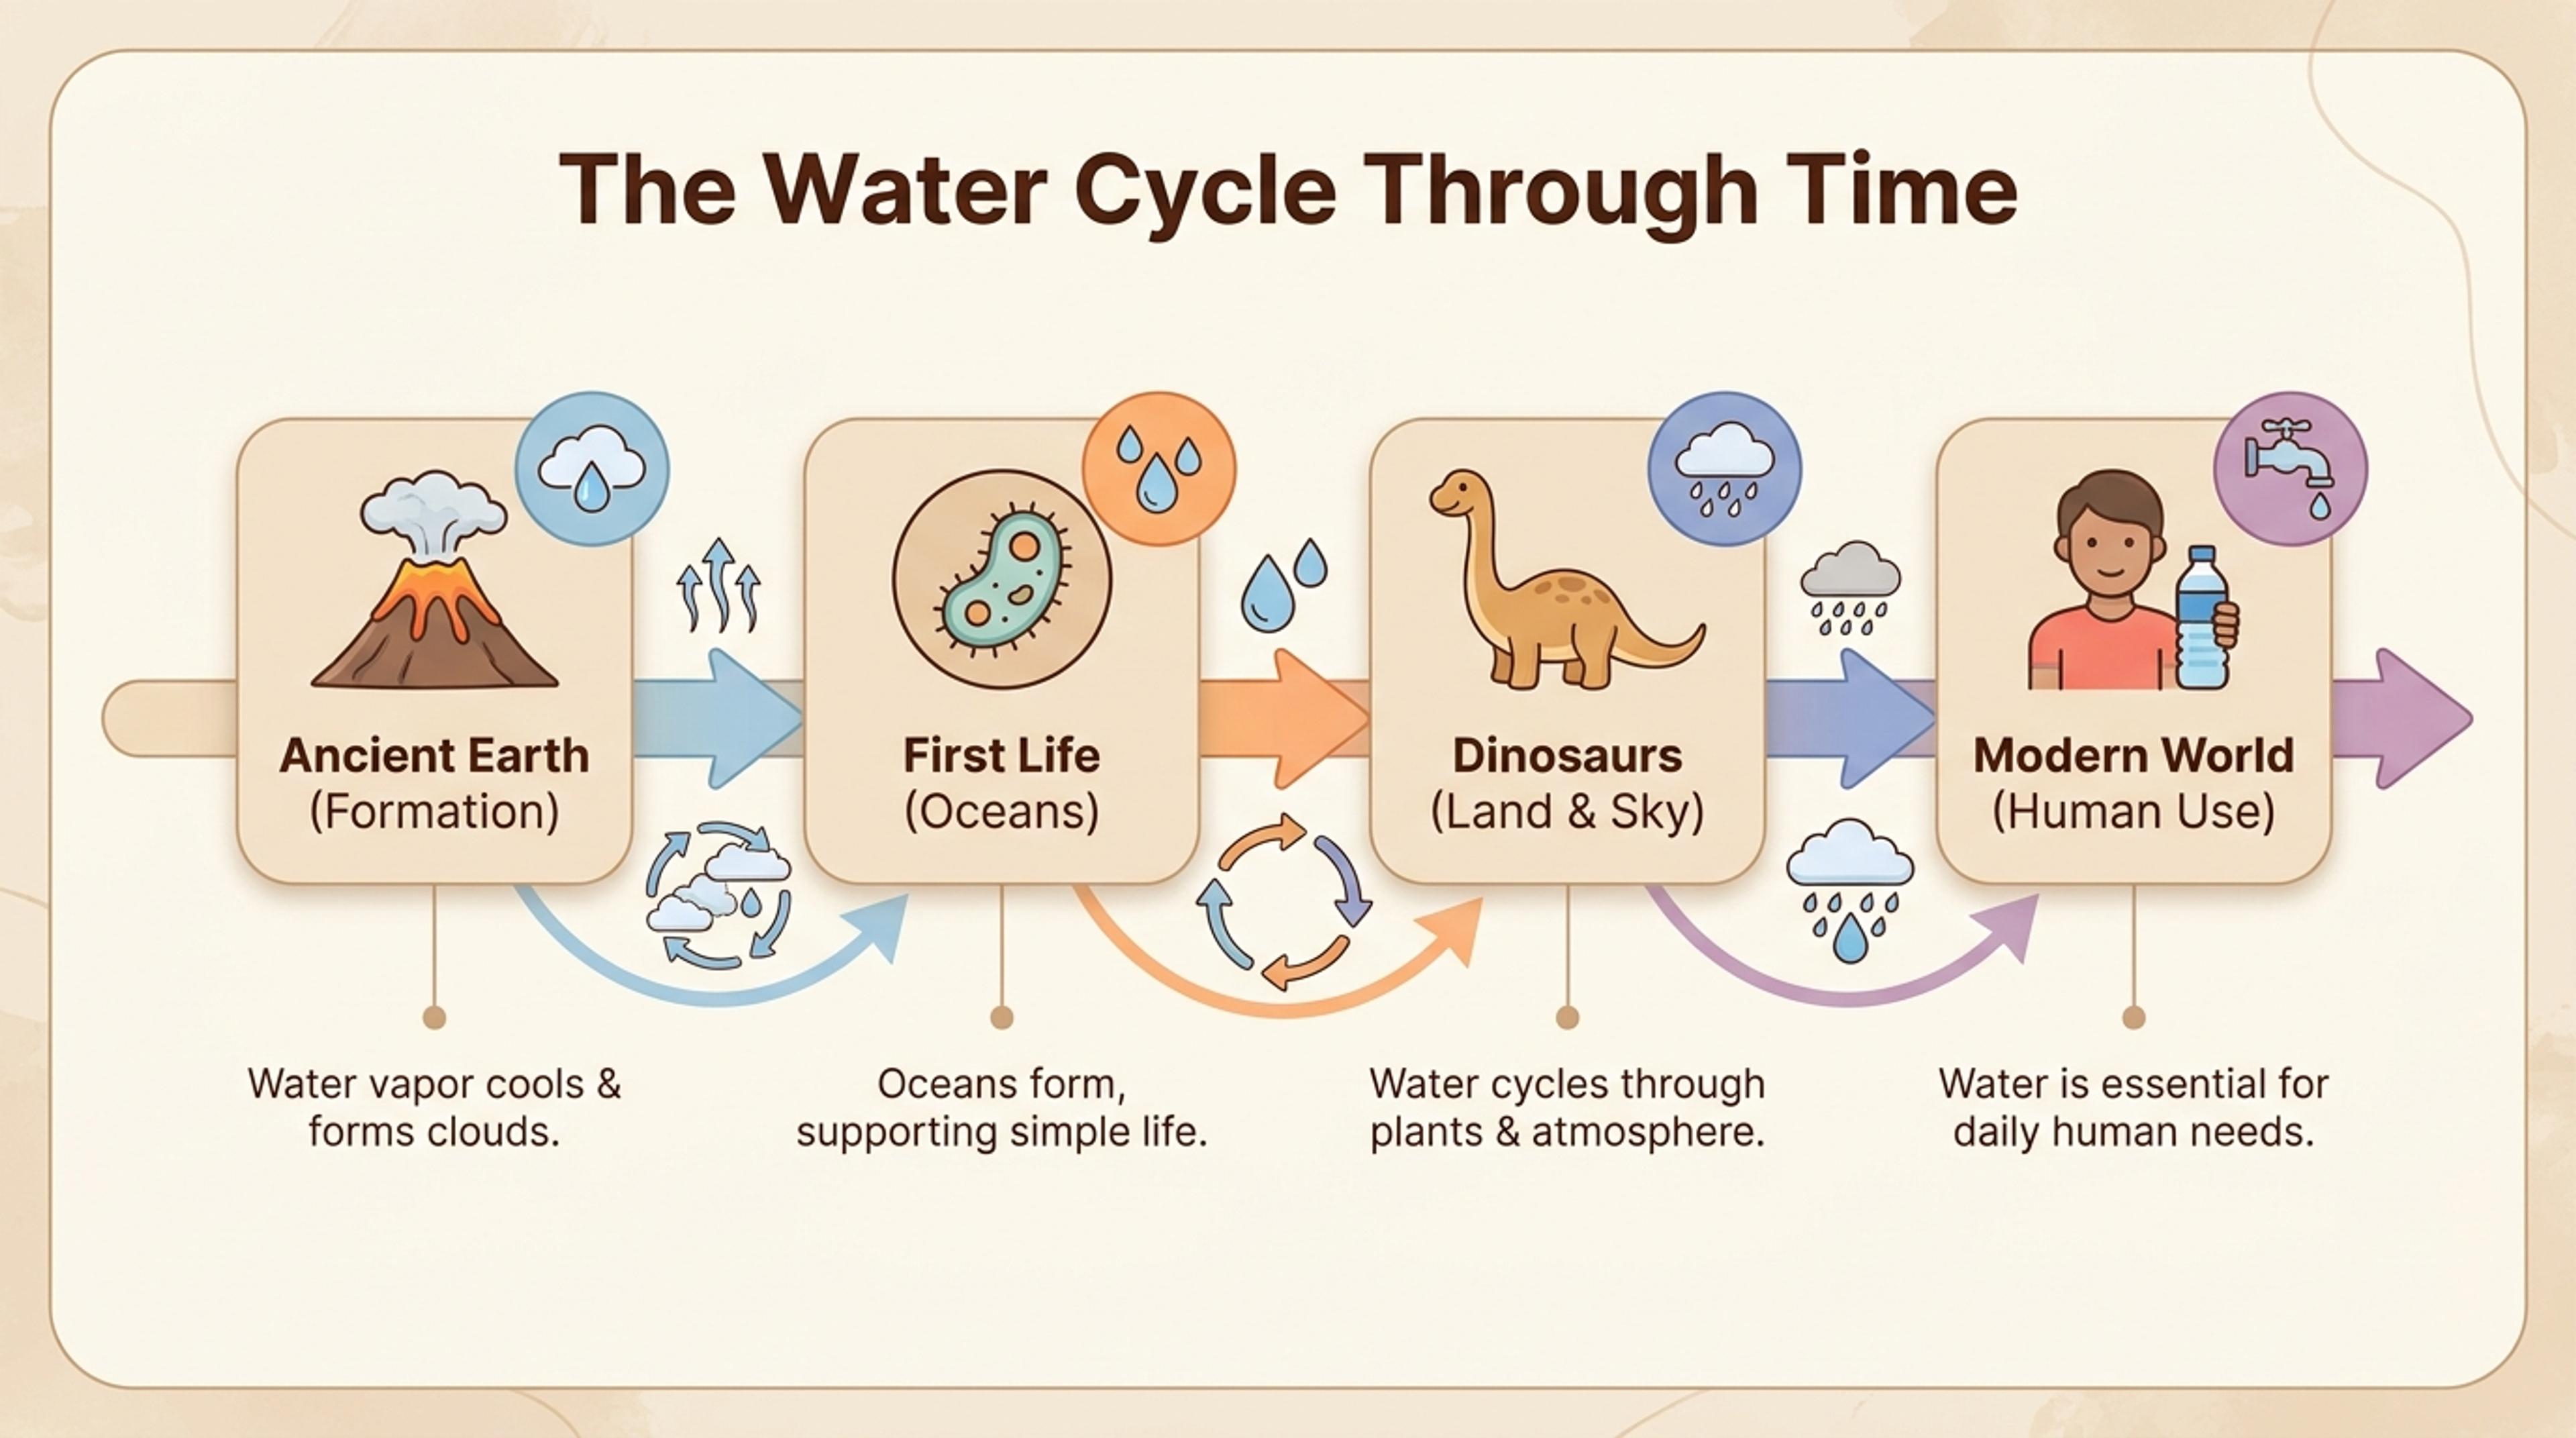
Show milestones, deadlines, or historical events as a sequence people can understand at a glance.
You can start from a topic, pasted notes, a file, or a link. The best inputs are materials that already contain a process, comparison, timeline, framework, or explanation that would be easier to understand visually.
It can suggest a structure, but you stay in control. Use the first draft to decide whether the idea works better as a timeline, diagram, chart, hierarchy, or another visual layout.
Yes. The visual is intended for presentation workflows, so you can use it as part of a deck, edit the wording, and keep refining the slide before sharing it.
Treat it as a strong first draft. You should still check the structure, shorten labels, remove anything inaccurate, and make sure the emphasis matches your audience.
It is useful for educators, consultants, marketers, analysts, product teams, researchers, and anyone who needs to explain information more clearly in a presentation.
Explore diagram and infographic types that help turn a rough idea into a clearer presentation visual.
Turn events, milestones, roadmap phases, project plans, and historical sequences into a slide-ready timeline.
Compare overlap, differences, shared traits, and strategic fit with an editable Venn diagram for slides.
Organize scattered notes, research themes, brainstorms, and lesson topics into a clear editable mind map.
Show linear workflows, handoffs, intake processes, and delivery stages as a clean pipe process diagram.
Show cycles, recurring workflows, feedback loops, and continuous improvement processes as a clear circular visual.
Show hierarchy, foundations, priority levels, maturity stages, and strategic layers in a pyramid chart.
Organize strengths, weaknesses, opportunities, and threats into a clear strategic planning slide.
Structure political, economic, social, technological, legal, and environmental factors into a strategic planning slide.
Visualize conversion stages, selection processes, sales pipelines, recruiting steps, and drop-off points in a funnel chart.
Explain DNA concepts, paired research tracks, or two connected strands of work with an editable double helix visual.
Turn proportions, category shares, budgets, survey results, and allocation data into a clean doughnut chart for slides.
Map thinking patterns, learning concepts, mental models, and decision factors in a brain-shaped presentation visual.
Turn ideas, insights, concepts, and workshop prompts into a light bulb visual that is easy to present.
Turn a problem statement, notes, documents, or links into an editable Ishikawa diagram for root-cause analysis and PowerPoint.
Start with notes, a topic, a document, or a link and turn the idea into an editable infographic draft.