


Show what comes first
Turn notes about strategy, skills, services, or requirements into levels that make the foundation clear.
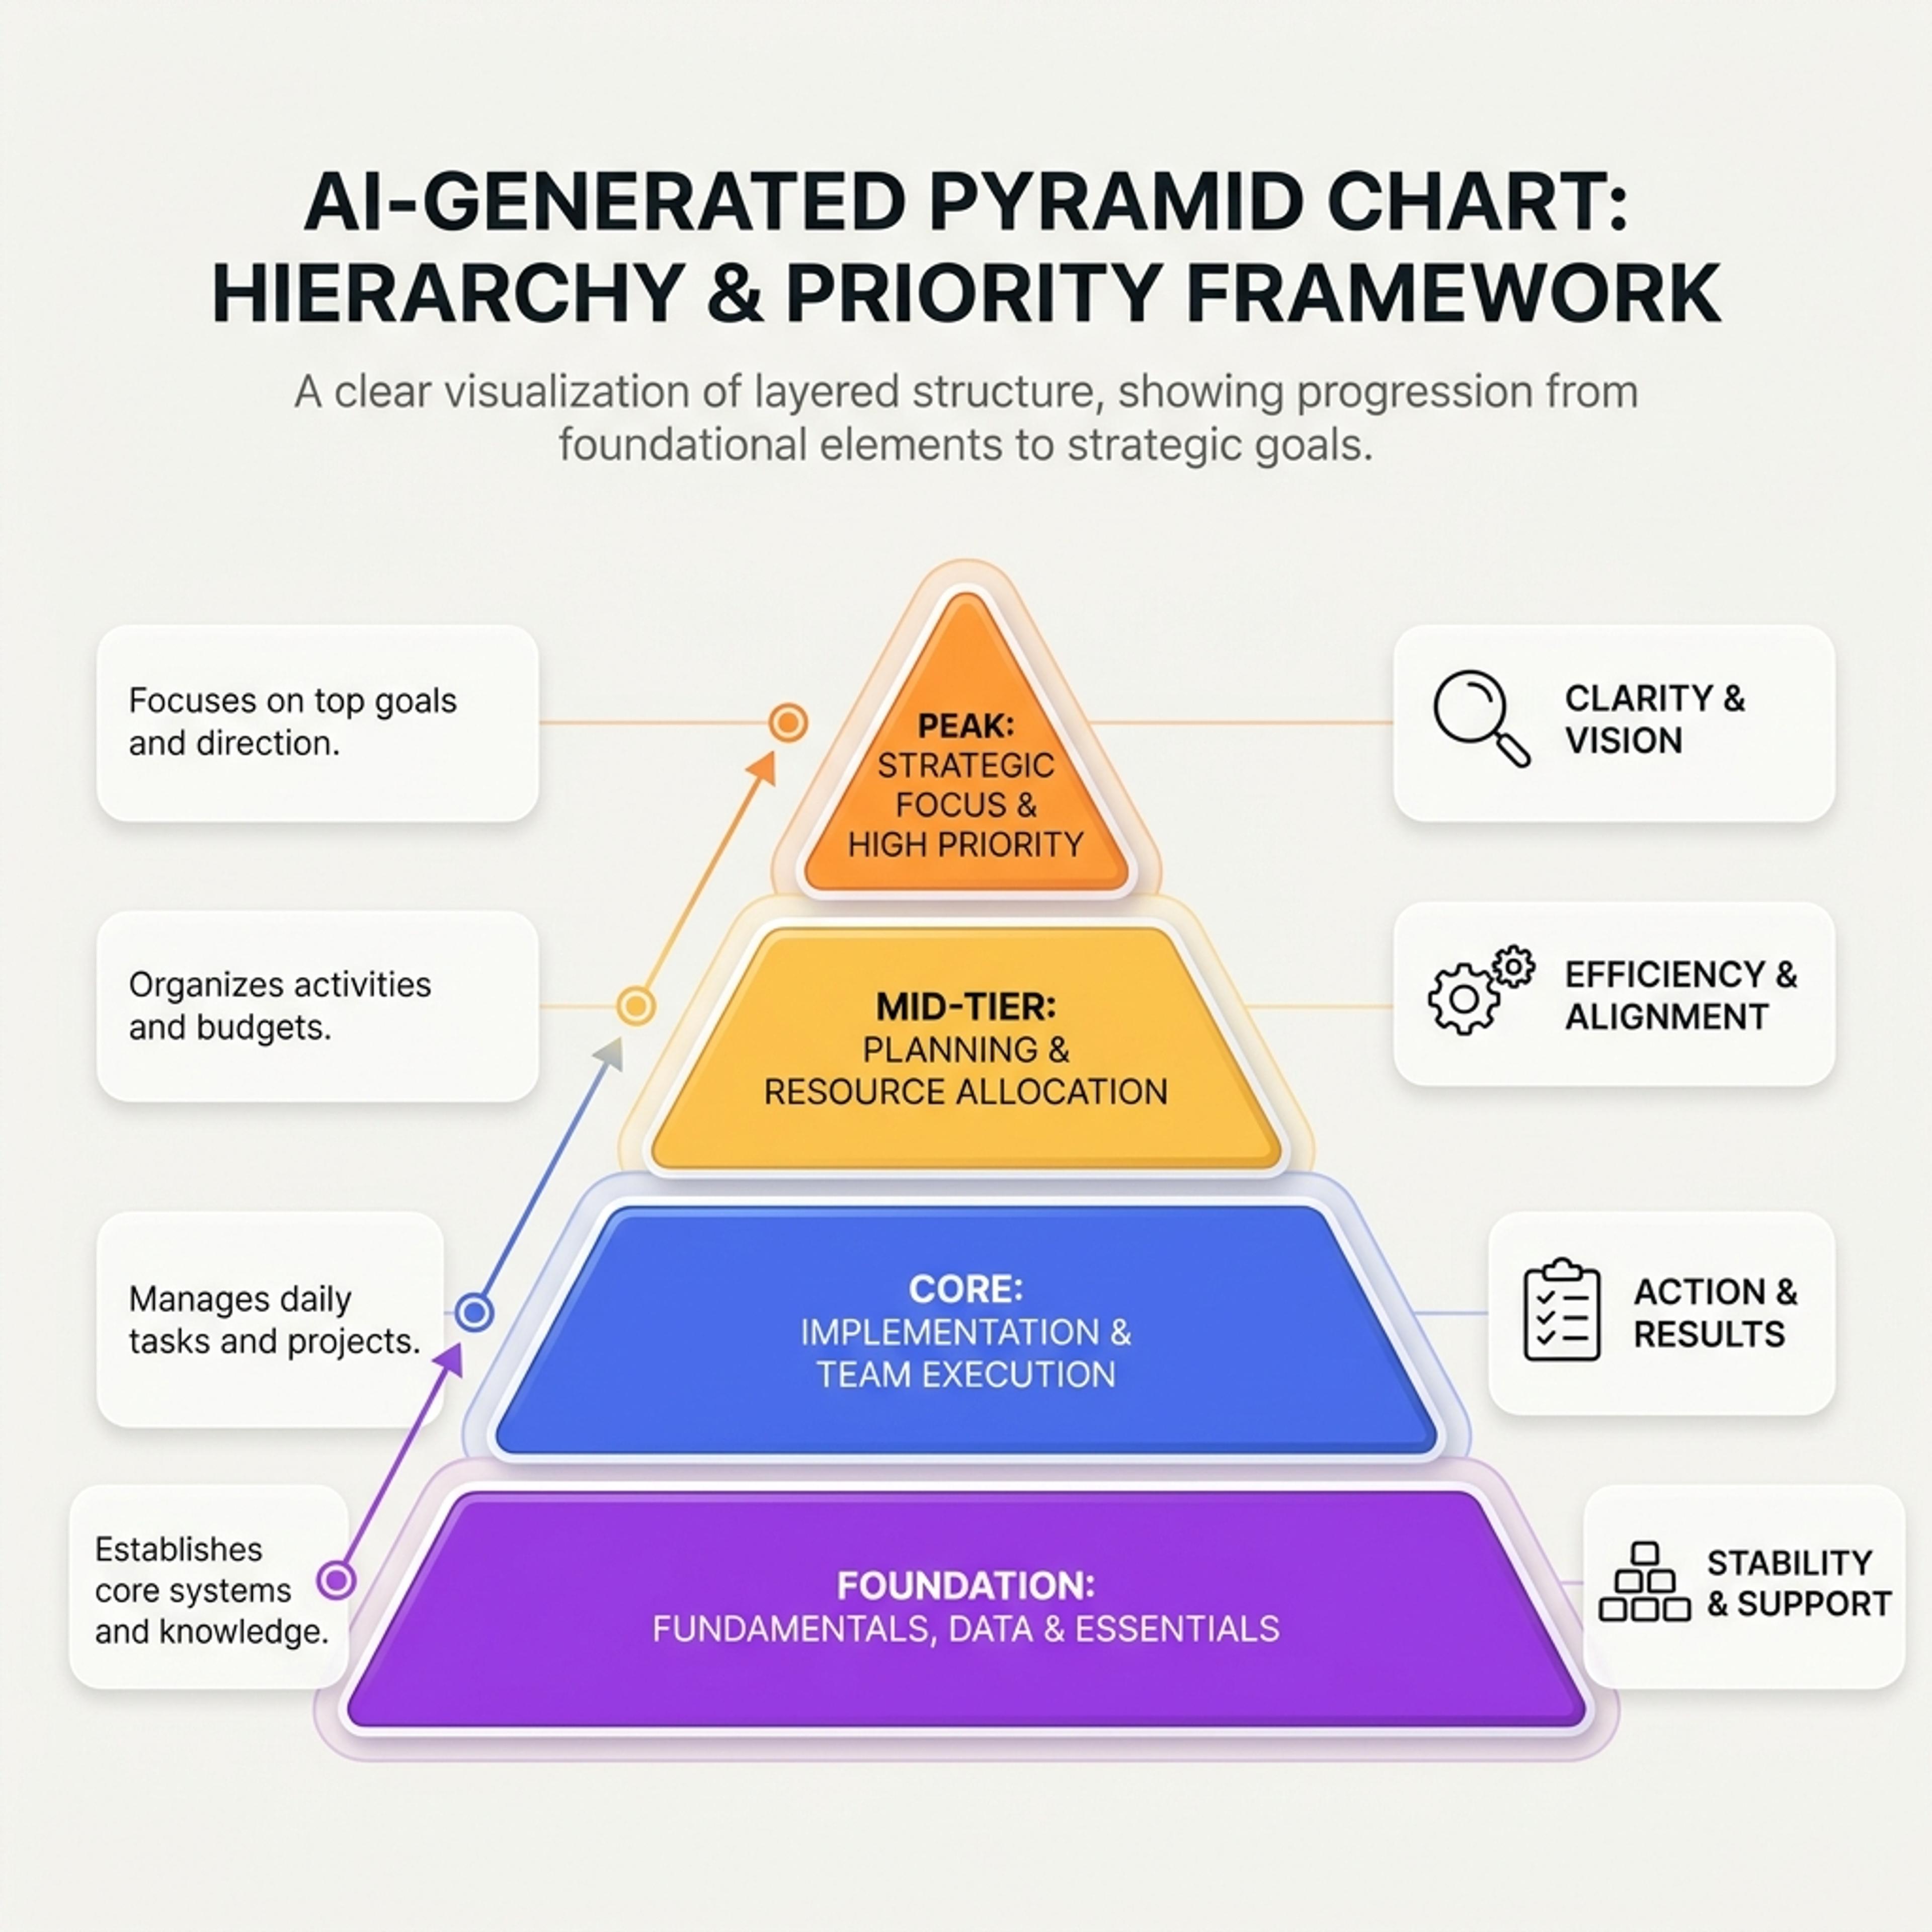
Show hierarchy, foundations, priority levels, maturity stages, and strategic layers in a pyramid chart.
Drag & drop your file here or
A pyramid chart shows levels that build on one another, making it useful for priorities, foundations, maturity models, and learning progressions.
Use this format when some ideas support others and the audience needs to see the order of importance.
Turn notes about strategy, skills, services, or requirements into levels that make the foundation clear.
Use the pyramid to explain maturity, learning progression, priority tiers, or layered business models.
Help teams see what must be protected at the base before they debate higher-level goals.
Describe the hierarchy, then refine the levels so the base and top tell a clear story.
Enter the topic and the levels you want to explain, or paste notes that imply a hierarchy.
Tell AI whether the pyramid is about priorities, learning, maturity, strategy, services, or needs.
Review the order, shorten each label, and make sure the base really supports the levels above it.
Use pyramid charts to explain levels, foundations, maturity, priorities, or stacked strategy.
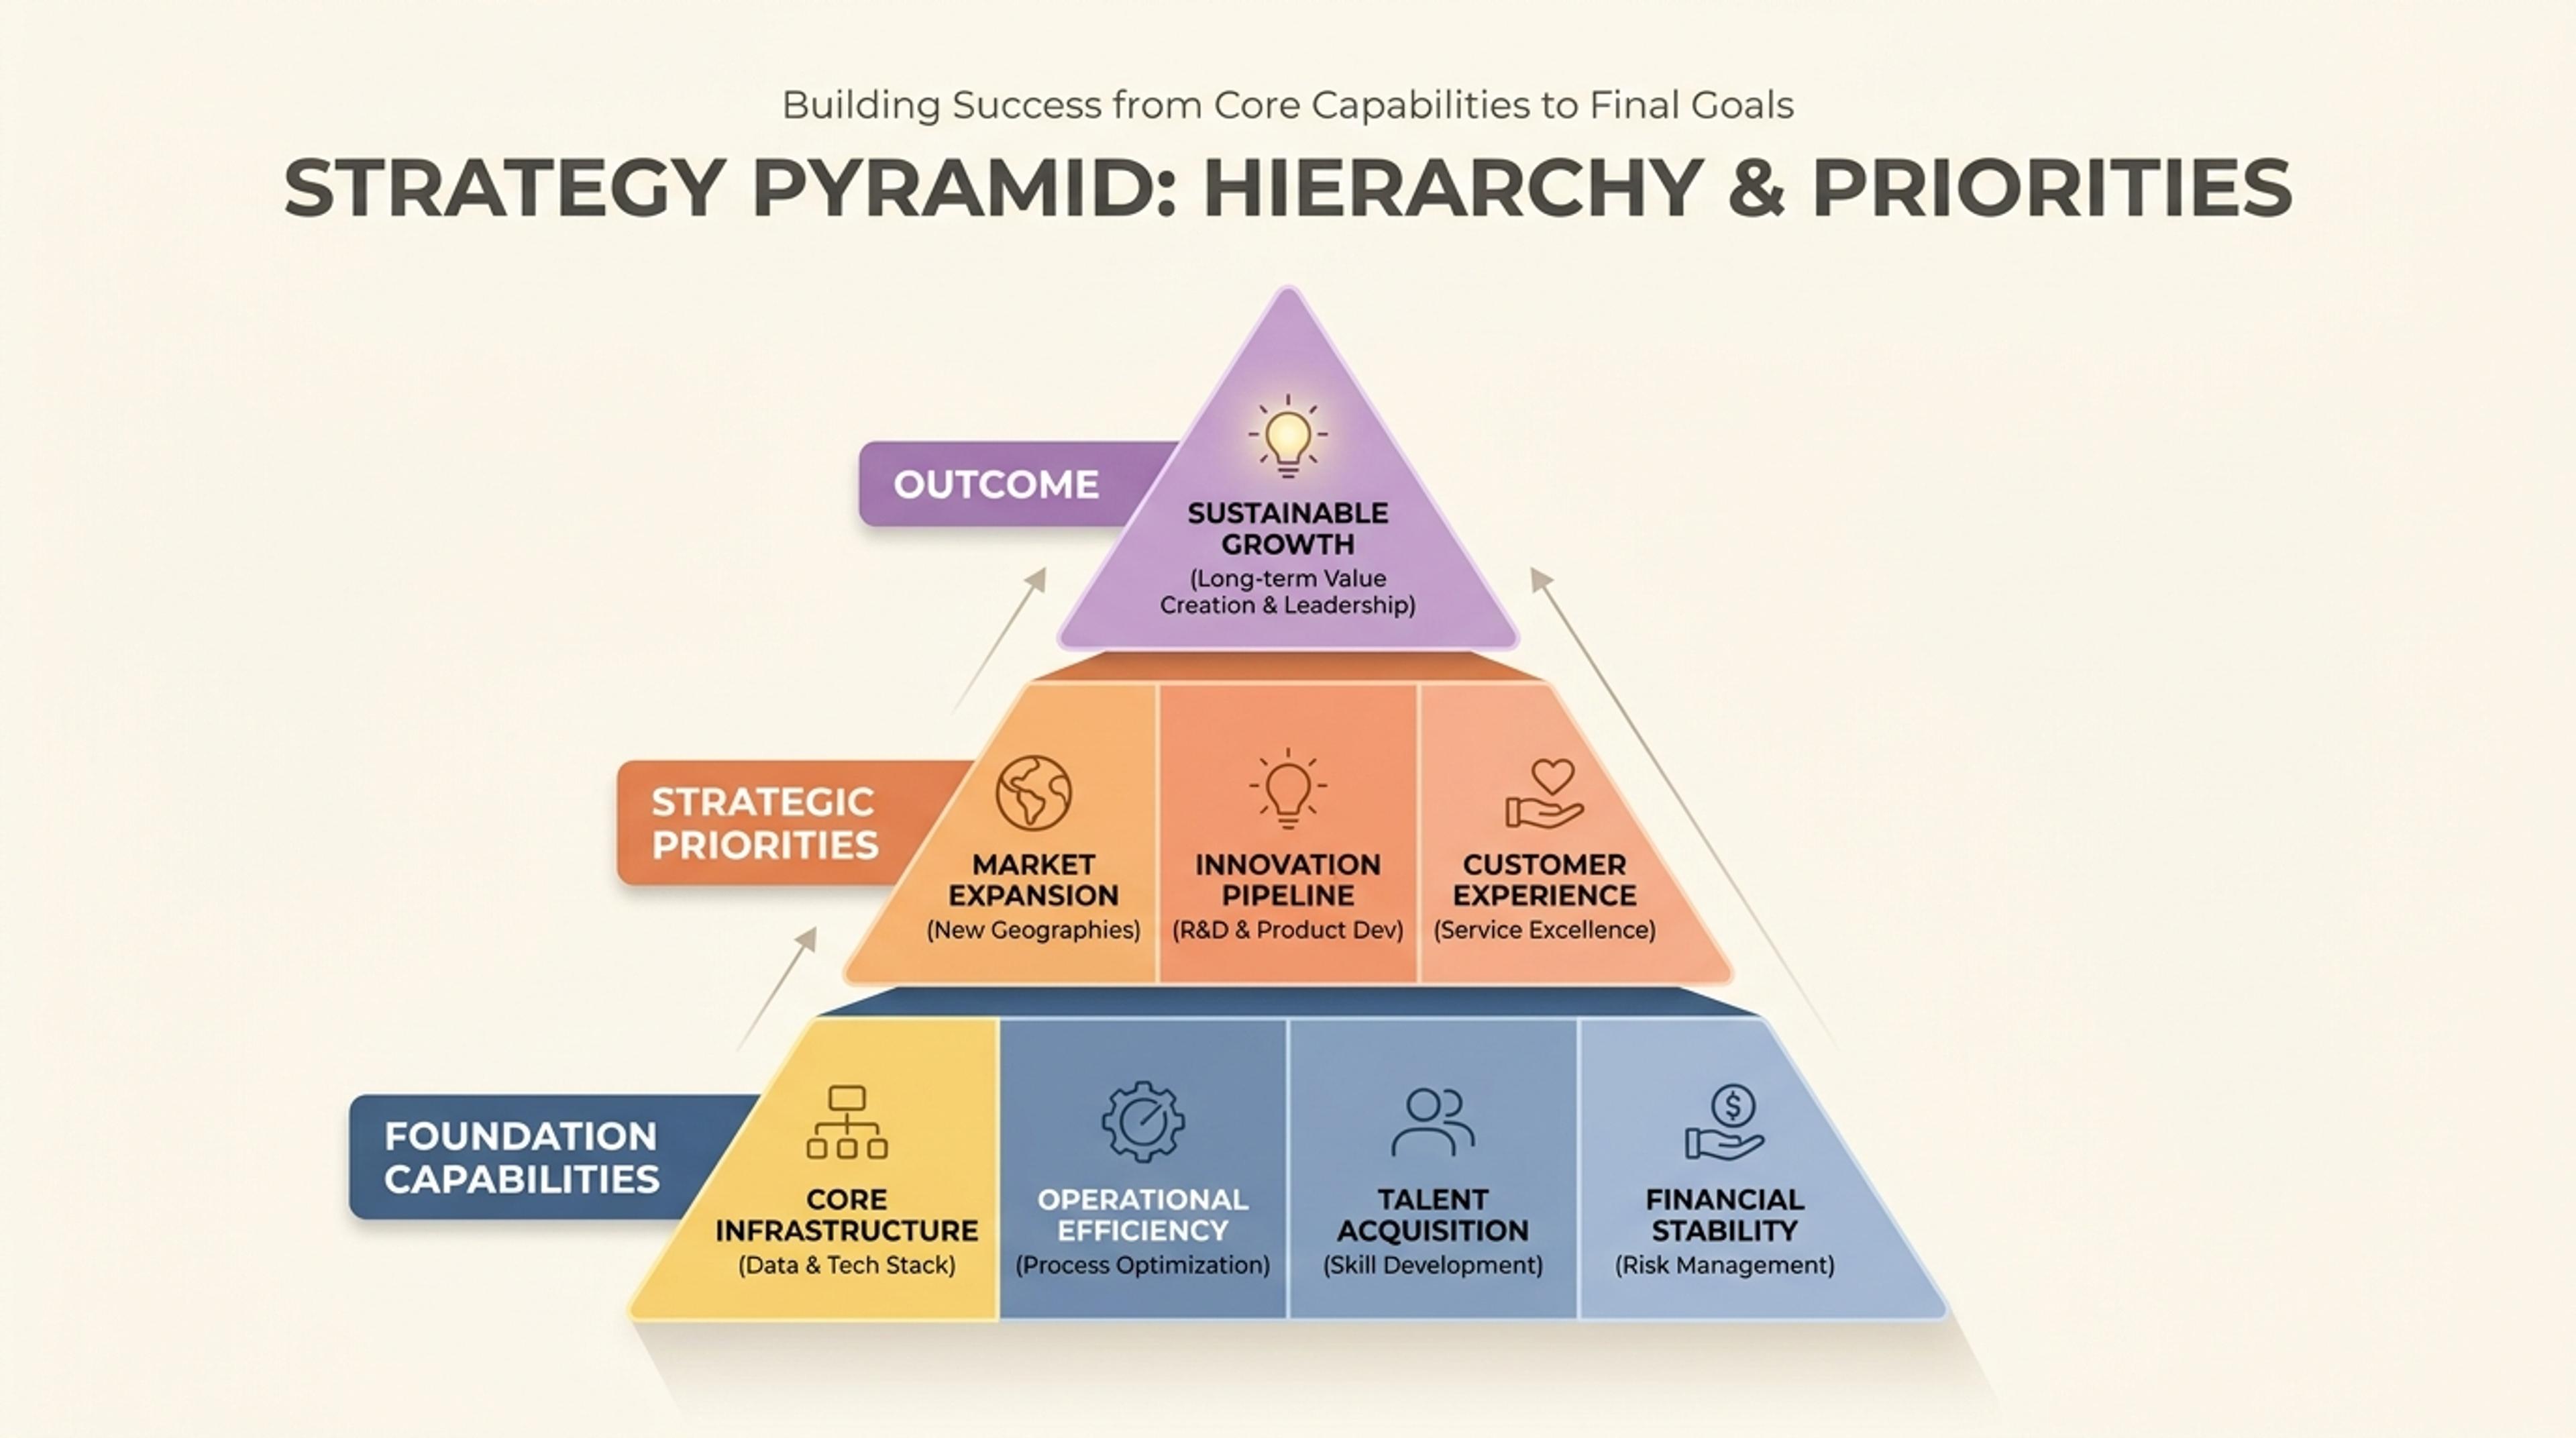
A hierarchy slide that moves from foundation capabilities to strategic priorities and top-level outcome.
Use it when the message depends on hierarchy, foundations, levels, or priorities. It is less useful for processes that happen in time order.
The bottom should be the foundation: the thing that supports the other levels, happens first, or matters most broadly.
Yes. Provide the skill levels or competency notes, then review whether the progression makes sense for your learners.
Three to five levels usually works best in a presentation. More levels can become cramped and harder to read.
Yes. You should review and reorder levels so the pyramid accurately reflects your framework.
Use these formats when a pyramid needs strategic context, market analysis, or a process view.
Turn topics, notes, documents, and links into editable visuals for slide decks, lessons, reports, and planning conversations.
Organize strengths, weaknesses, opportunities, and threats into a clear strategic planning slide.
Structure political, economic, social, technological, legal, and environmental factors into a strategic planning slide.
Visualize conversion stages, selection processes, sales pipelines, recruiting steps, and drop-off points in a funnel chart.
Organize scattered notes, research themes, brainstorms, and lesson topics into a clear editable mind map.
Describe the hierarchy, priorities, or maturity levels and turn them into an editable pyramid visual.