


Structure causes with the right categories
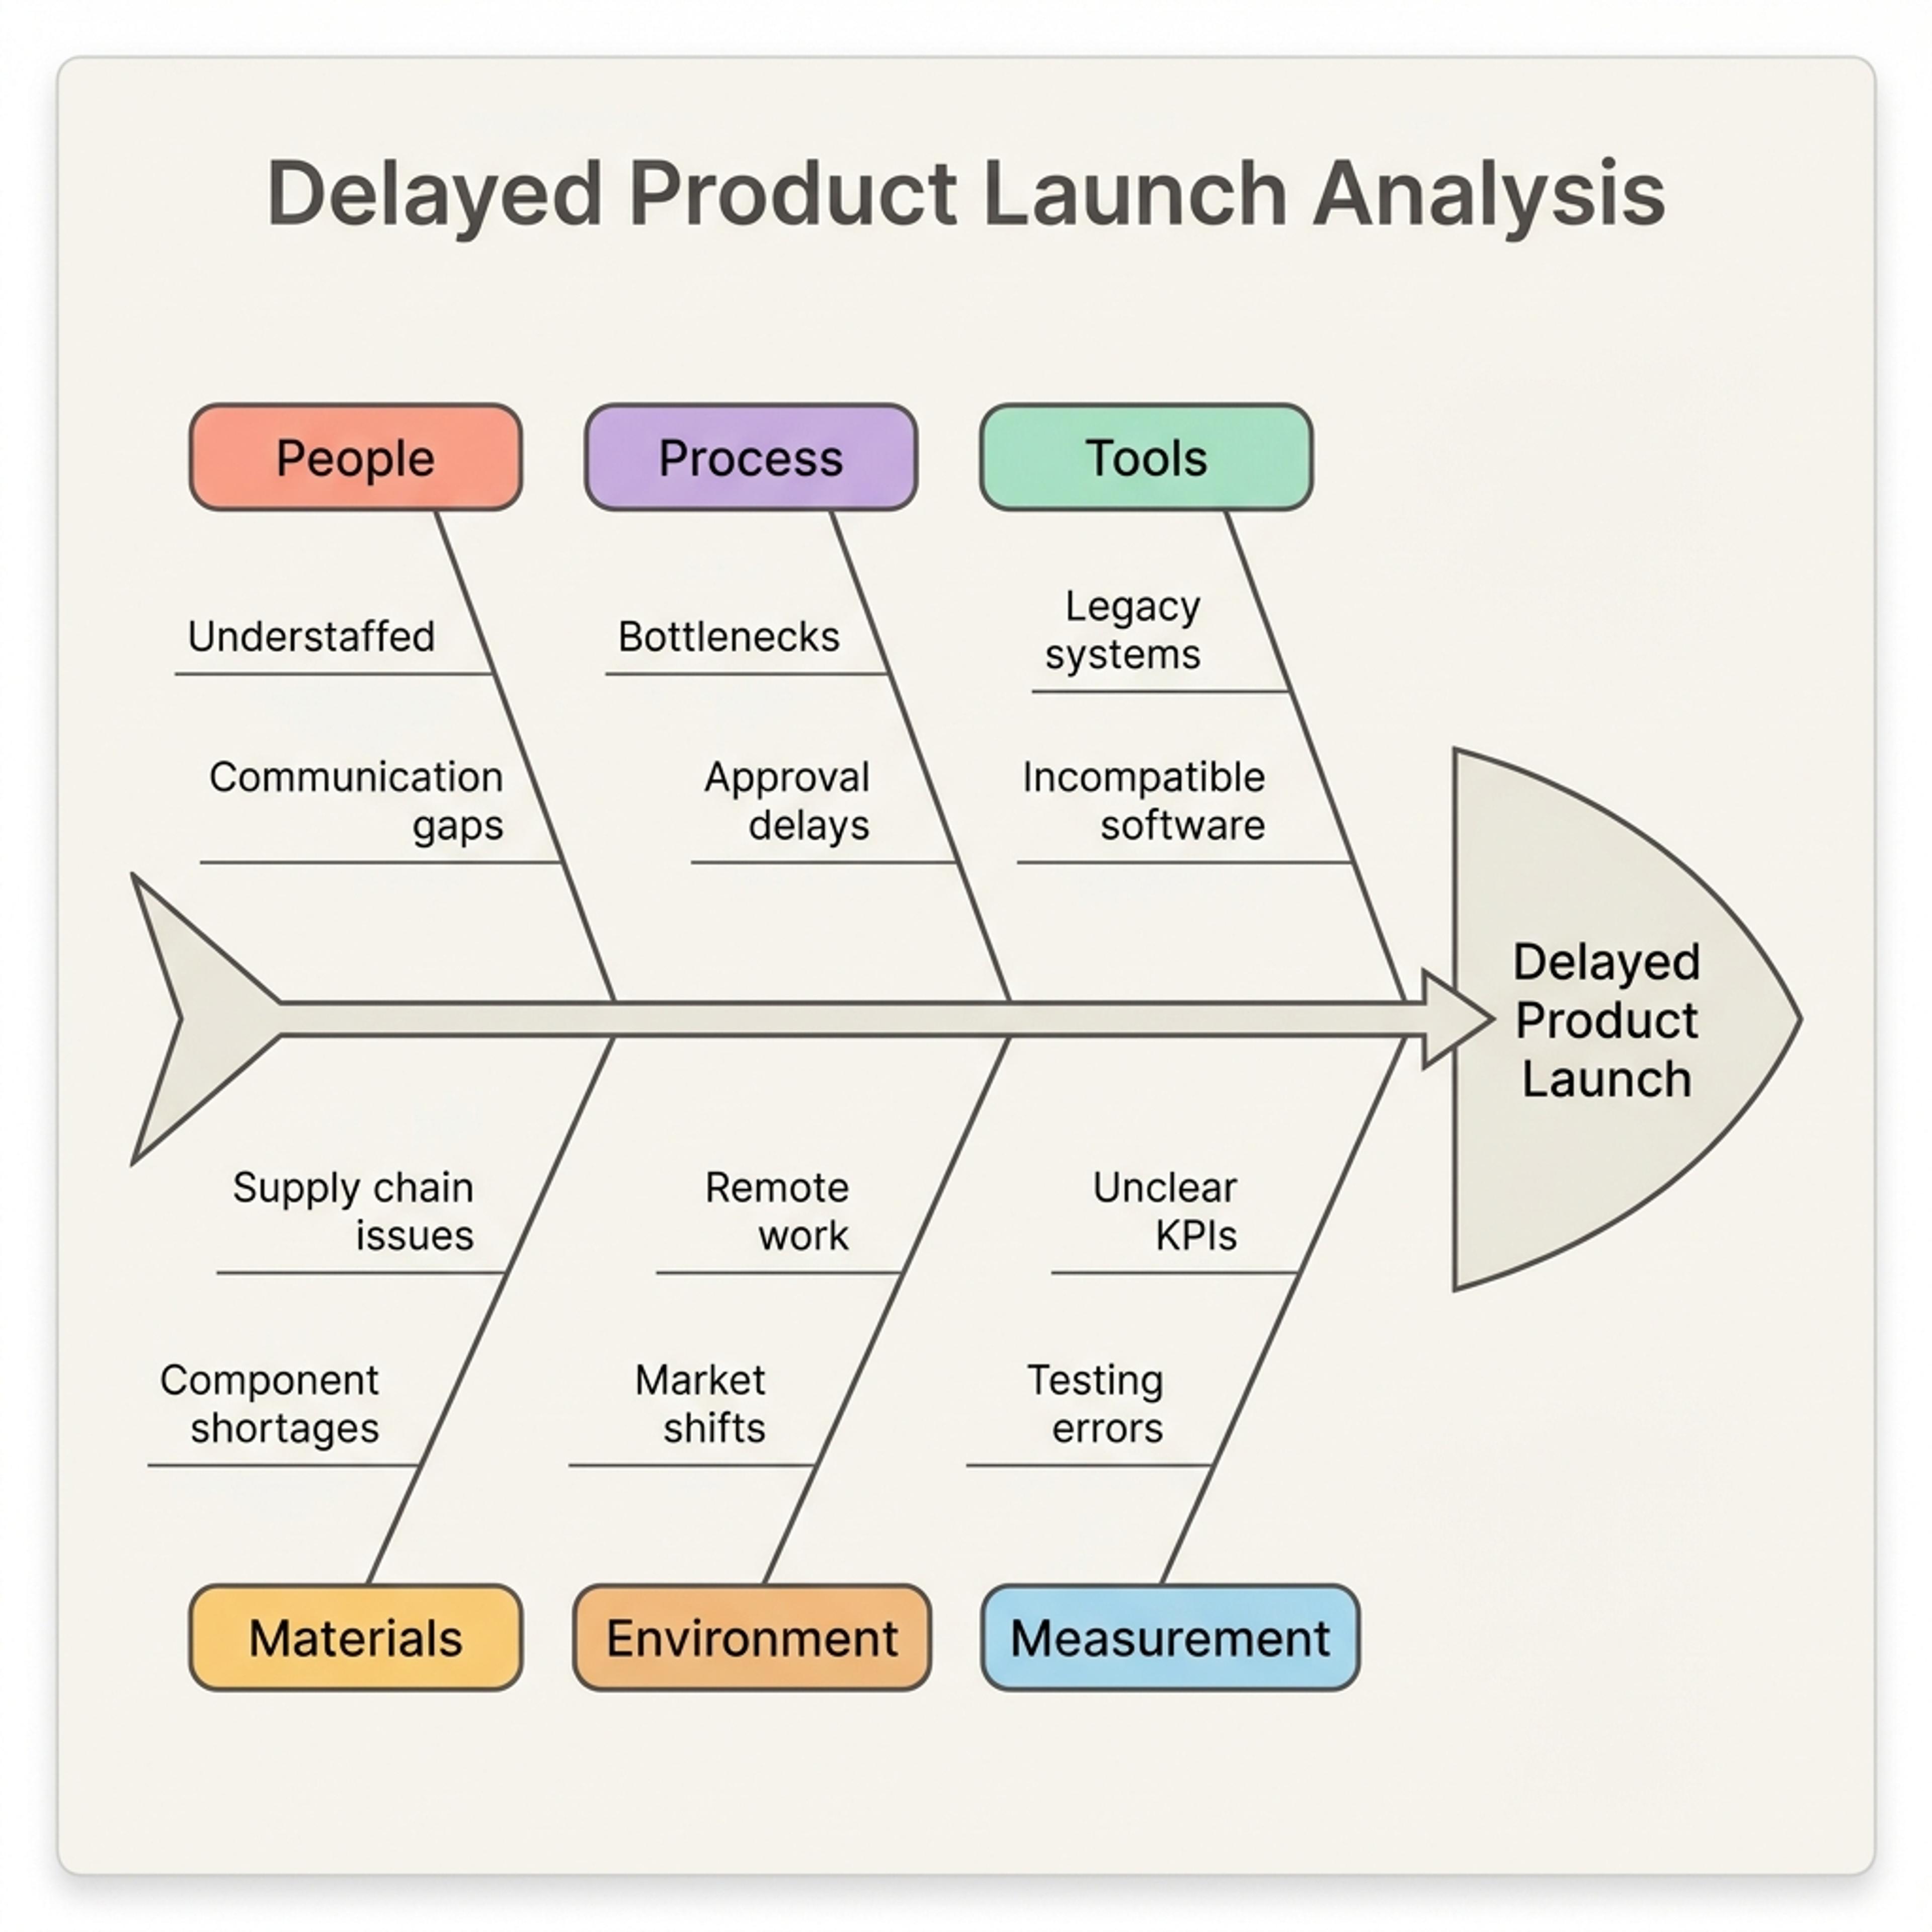
Start with the classic 6M categories—People, Machine, Method, Material, Measurement, and Environment—or replace them with categories that better fit a service, product, project, or customer problem.
Turn a problem statement, notes, documents, or links into an editable Ishikawa diagram for root-cause analysis and PowerPoint.
Drag & drop your file here or
A fishbone diagram, also known as an Ishikawa or cause-and-effect diagram, places a problem at the head and organizes possible causes along connected branches. It helps teams turn scattered observations into a structured root-cause analysis before prioritizing evidence and corrective actions.
Organize what might be driving a problem, show how each cause relates to the effect, and give your team a focused structure for investigation.
Start with the classic 6M categories—People, Machine, Method, Material, Measurement, and Environment—or replace them with categories that better fit a service, product, project, or customer problem.
Paste workshop notes, upload a document, add research text, or use a link. SlidesPilot helps turn the important causes and supporting details into readable branches instead of another unstructured list.
Use the finished diagram to compare hypotheses, identify missing evidence, choose the causes that deserve deeper analysis, and present the reasoning clearly in a review, lesson, report, or PowerPoint deck.
Begin with one clearly defined effect, add the context you already have, and refine the AI-generated structure into an analysis your audience can follow.
Describe the problem at the fish head in specific, observable terms. A focused statement such as “launch delayed by three weeks” produces a more useful diagram than a broad label such as “project issues.”
Enter known symptoms, suspected causes, meeting notes, process details, or source files. AI groups related ideas into main branches and sub-causes using 6M categories or a structure that fits your topic.
Rename categories, remove duplicates, add missing causes, and mark the branches that need evidence. Then use the editable result in a PowerPoint presentation, quality review, retrospective, workshop, or action-planning session.
See how the same cause-and-effect structure adapts to manufacturing, customer support, and project delivery. Each example starts with a specific effect and uses categories that match the problem instead of forcing every analysis into the same generic branches.
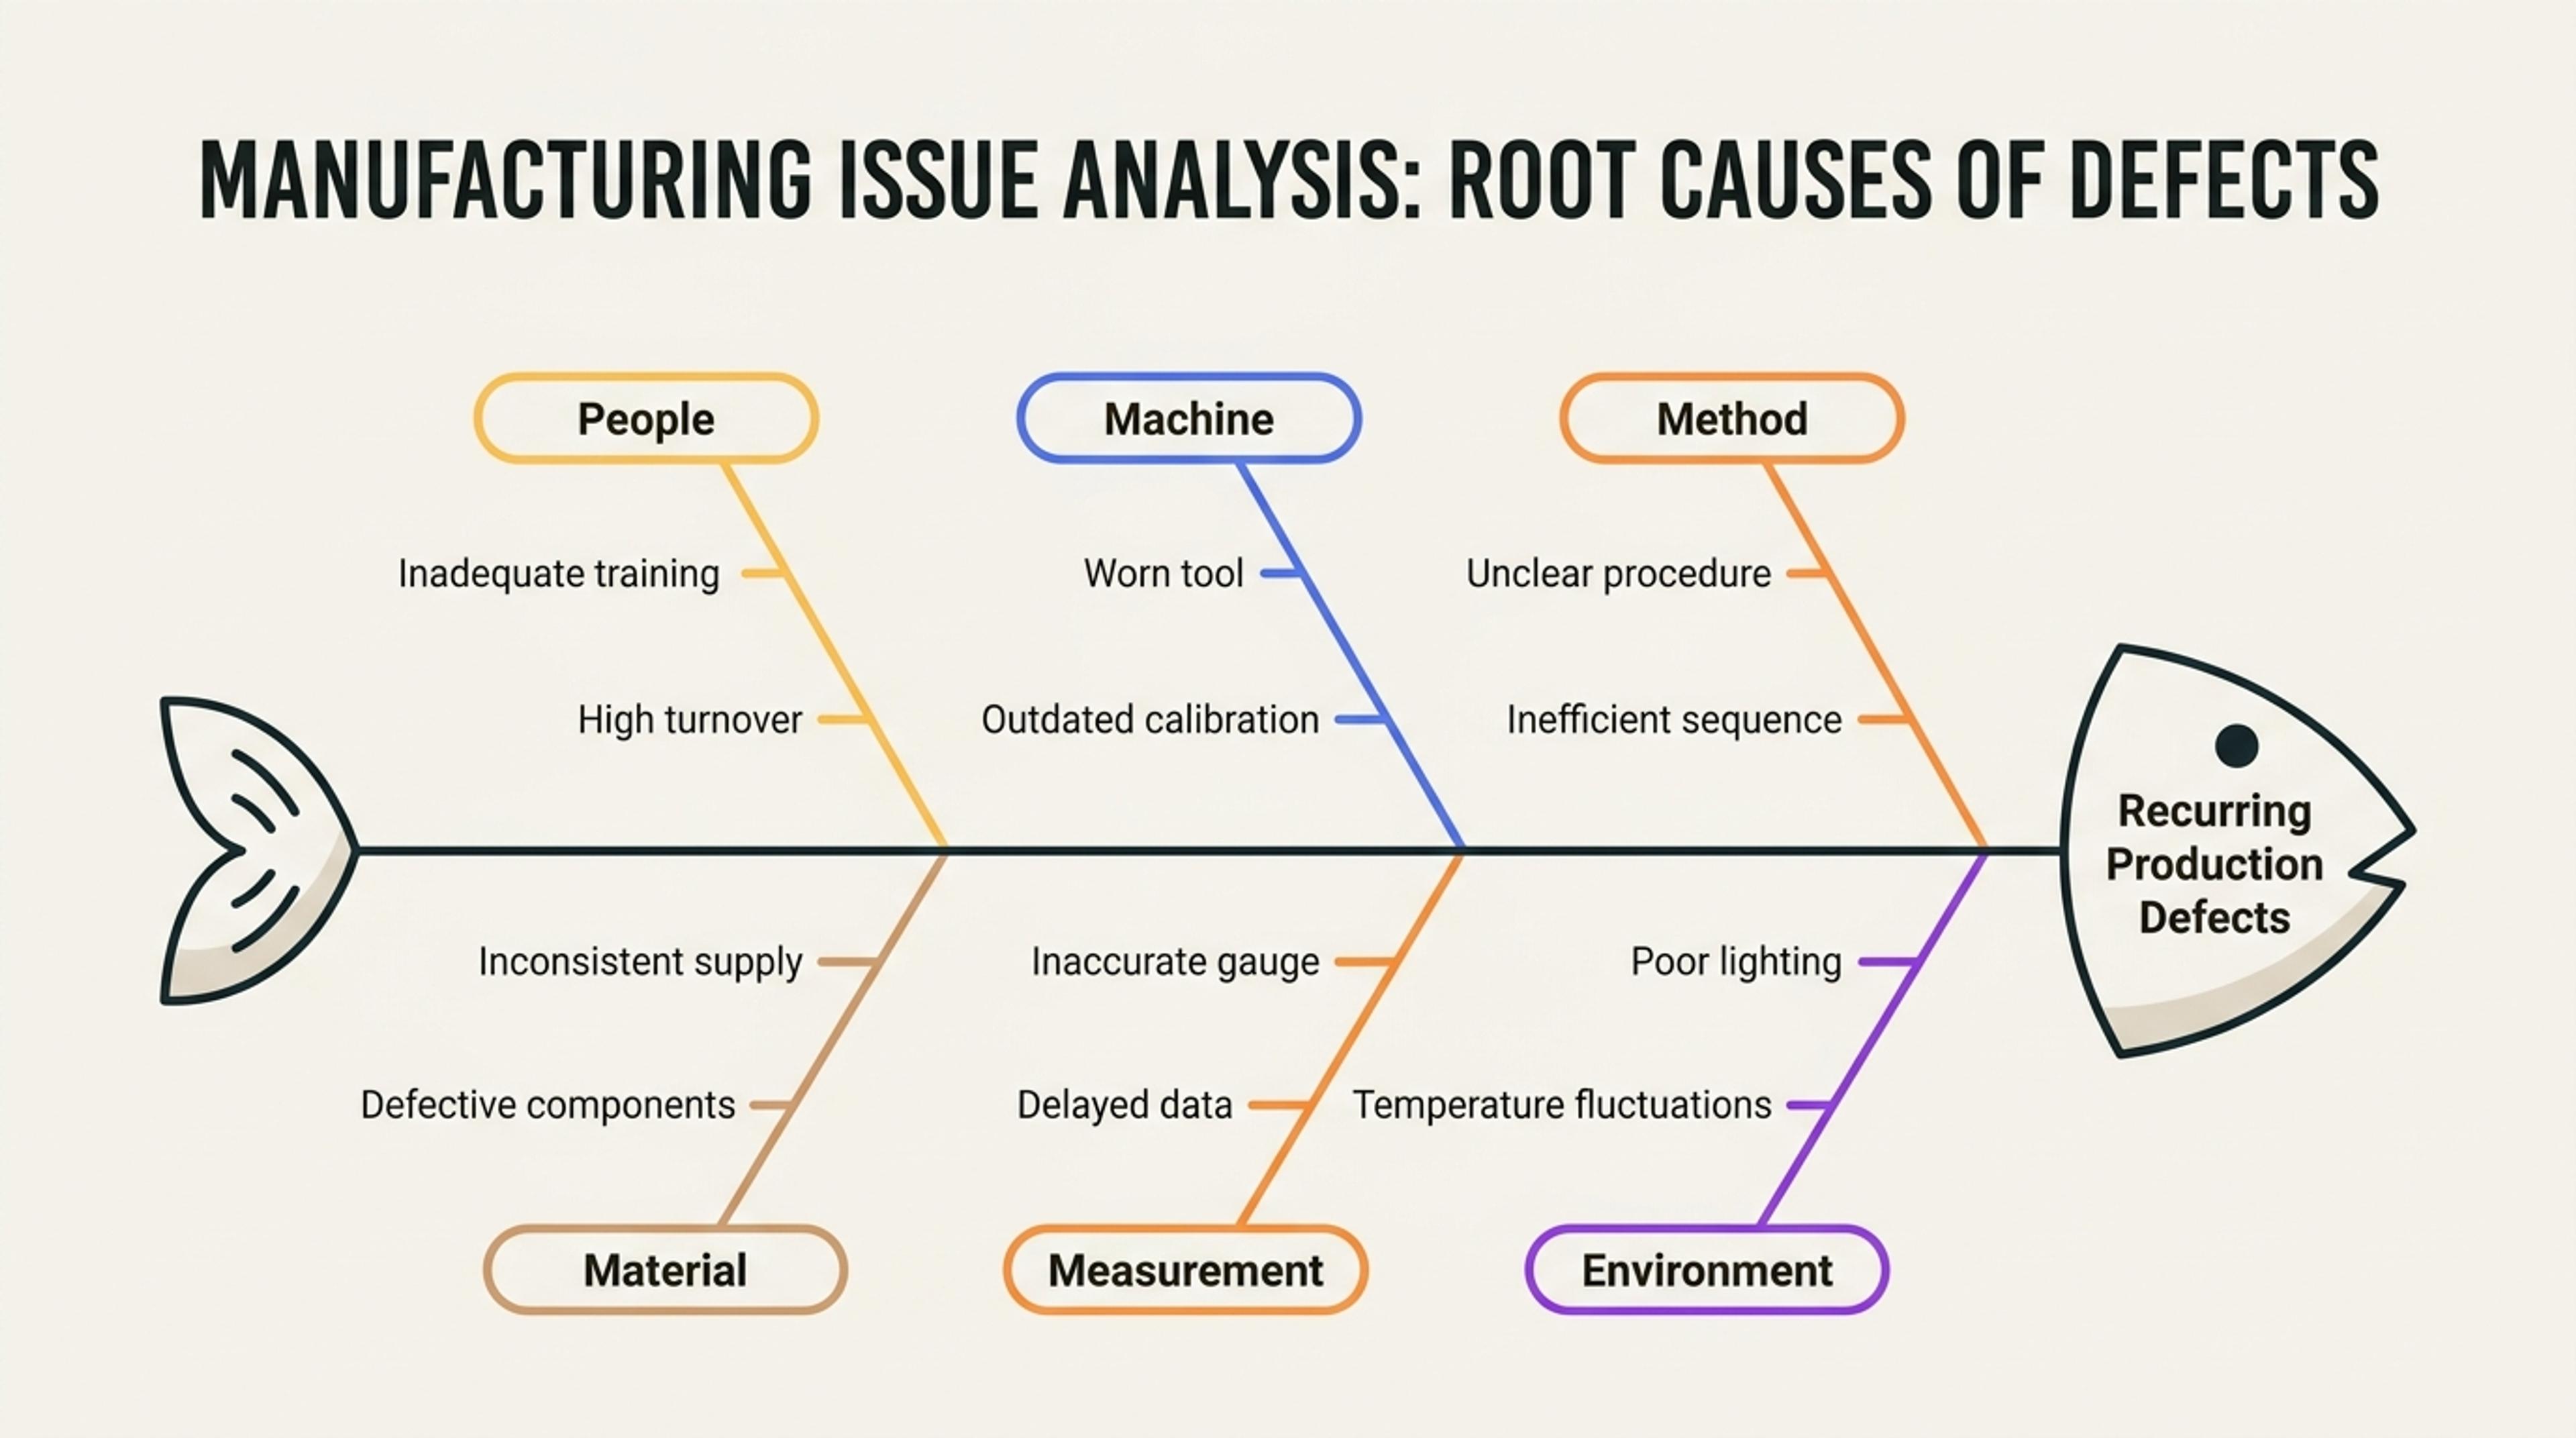
Investigate recurring production defects across People, Machine, Method, Material, Measurement, and Environment. The diagram helps quality teams separate equipment problems from process gaps, training issues, supply variation, and conditions on the production floor.
Fishbone diagrams are most useful when a group needs to organize competing explanations before deciding what to investigate or change.
Answers about creating, interpreting, editing, and presenting fishbone diagrams with AI.
A fishbone diagram is used to organize possible causes of a clearly defined problem. Teams use it during root-cause analysis, quality reviews, project retrospectives, process improvement, customer-experience investigations, lessons, and workshops when several contributing factors need to be considered together.
The traditional 6M categories are Manpower or People, Machine, Method, Material, Measurement, and Mother Nature or Environment. They are common in manufacturing, but you can rename the branches for service, product, healthcare, education, marketing, or project-management problems.
Describe the effect you want to investigate and add any known causes, notes, documents, text, or links. SlidesPilot can organize the source material into main branches and sub-causes, giving you an editable diagram draft to review before presenting or acting on it.
A fishbone diagram explores several categories and possible causes at the same time, while 5 Whys follows one causal path by repeatedly asking why. Teams often use the fishbone first to map the landscape, then apply 5 Whys to the most important branch.
Write a specific effect, involve people who understand the process, separate symptoms from possible causes, and attach evidence where available. After brainstorming, prioritize the branches worth testing and confirm the actual root cause with data, observation, interviews, or controlled changes.
Yes. Review the AI-generated structure, rename category labels, add or remove causes, simplify wording, and adjust the visual before sharing it. Editing is especially useful when your team uses custom categories or needs the diagram to match an existing report or presentation.
Yes. Fishbone diagrams work well in root-cause analysis slides, quality reports, operations reviews, project postmortems, training materials, and consulting presentations. Generate the first visual with SlidesPilot, refine the content, and use the result as part of your presentation workflow.
Continue from root-cause mapping into brainstorming, strategic analysis, process visualization, and presentation creation.
Explore other editable infographic formats for turning notes, files, and links into presentation visuals.
Use a mind map when you need open-ended brainstorming before organizing causes into a fishbone structure.
Compare internal strengths and weaknesses with external opportunities and threats for strategic planning.
Structure political, economic, social, technological, legal, and environmental factors around a decision.
Present the sequence of events, milestones, or delays after identifying the causes behind them.
Visualize stage-by-stage drop-off when the problem involves conversion, selection, or pipeline performance.
Start with a problem statement, workshop notes, a document, or a link. Generate an editable cause-and-effect diagram, refine the branches with your team, and turn the analysis into a presentation-ready visual.