


Map each stage clearly
Turn signup, sales, hiring, onboarding, or review stages into a funnel that shows what happens at each step.
Visualize conversion stages, selection processes, sales pipelines, recruiting steps, and drop-off points in a funnel chart.
Drag & drop your file here or
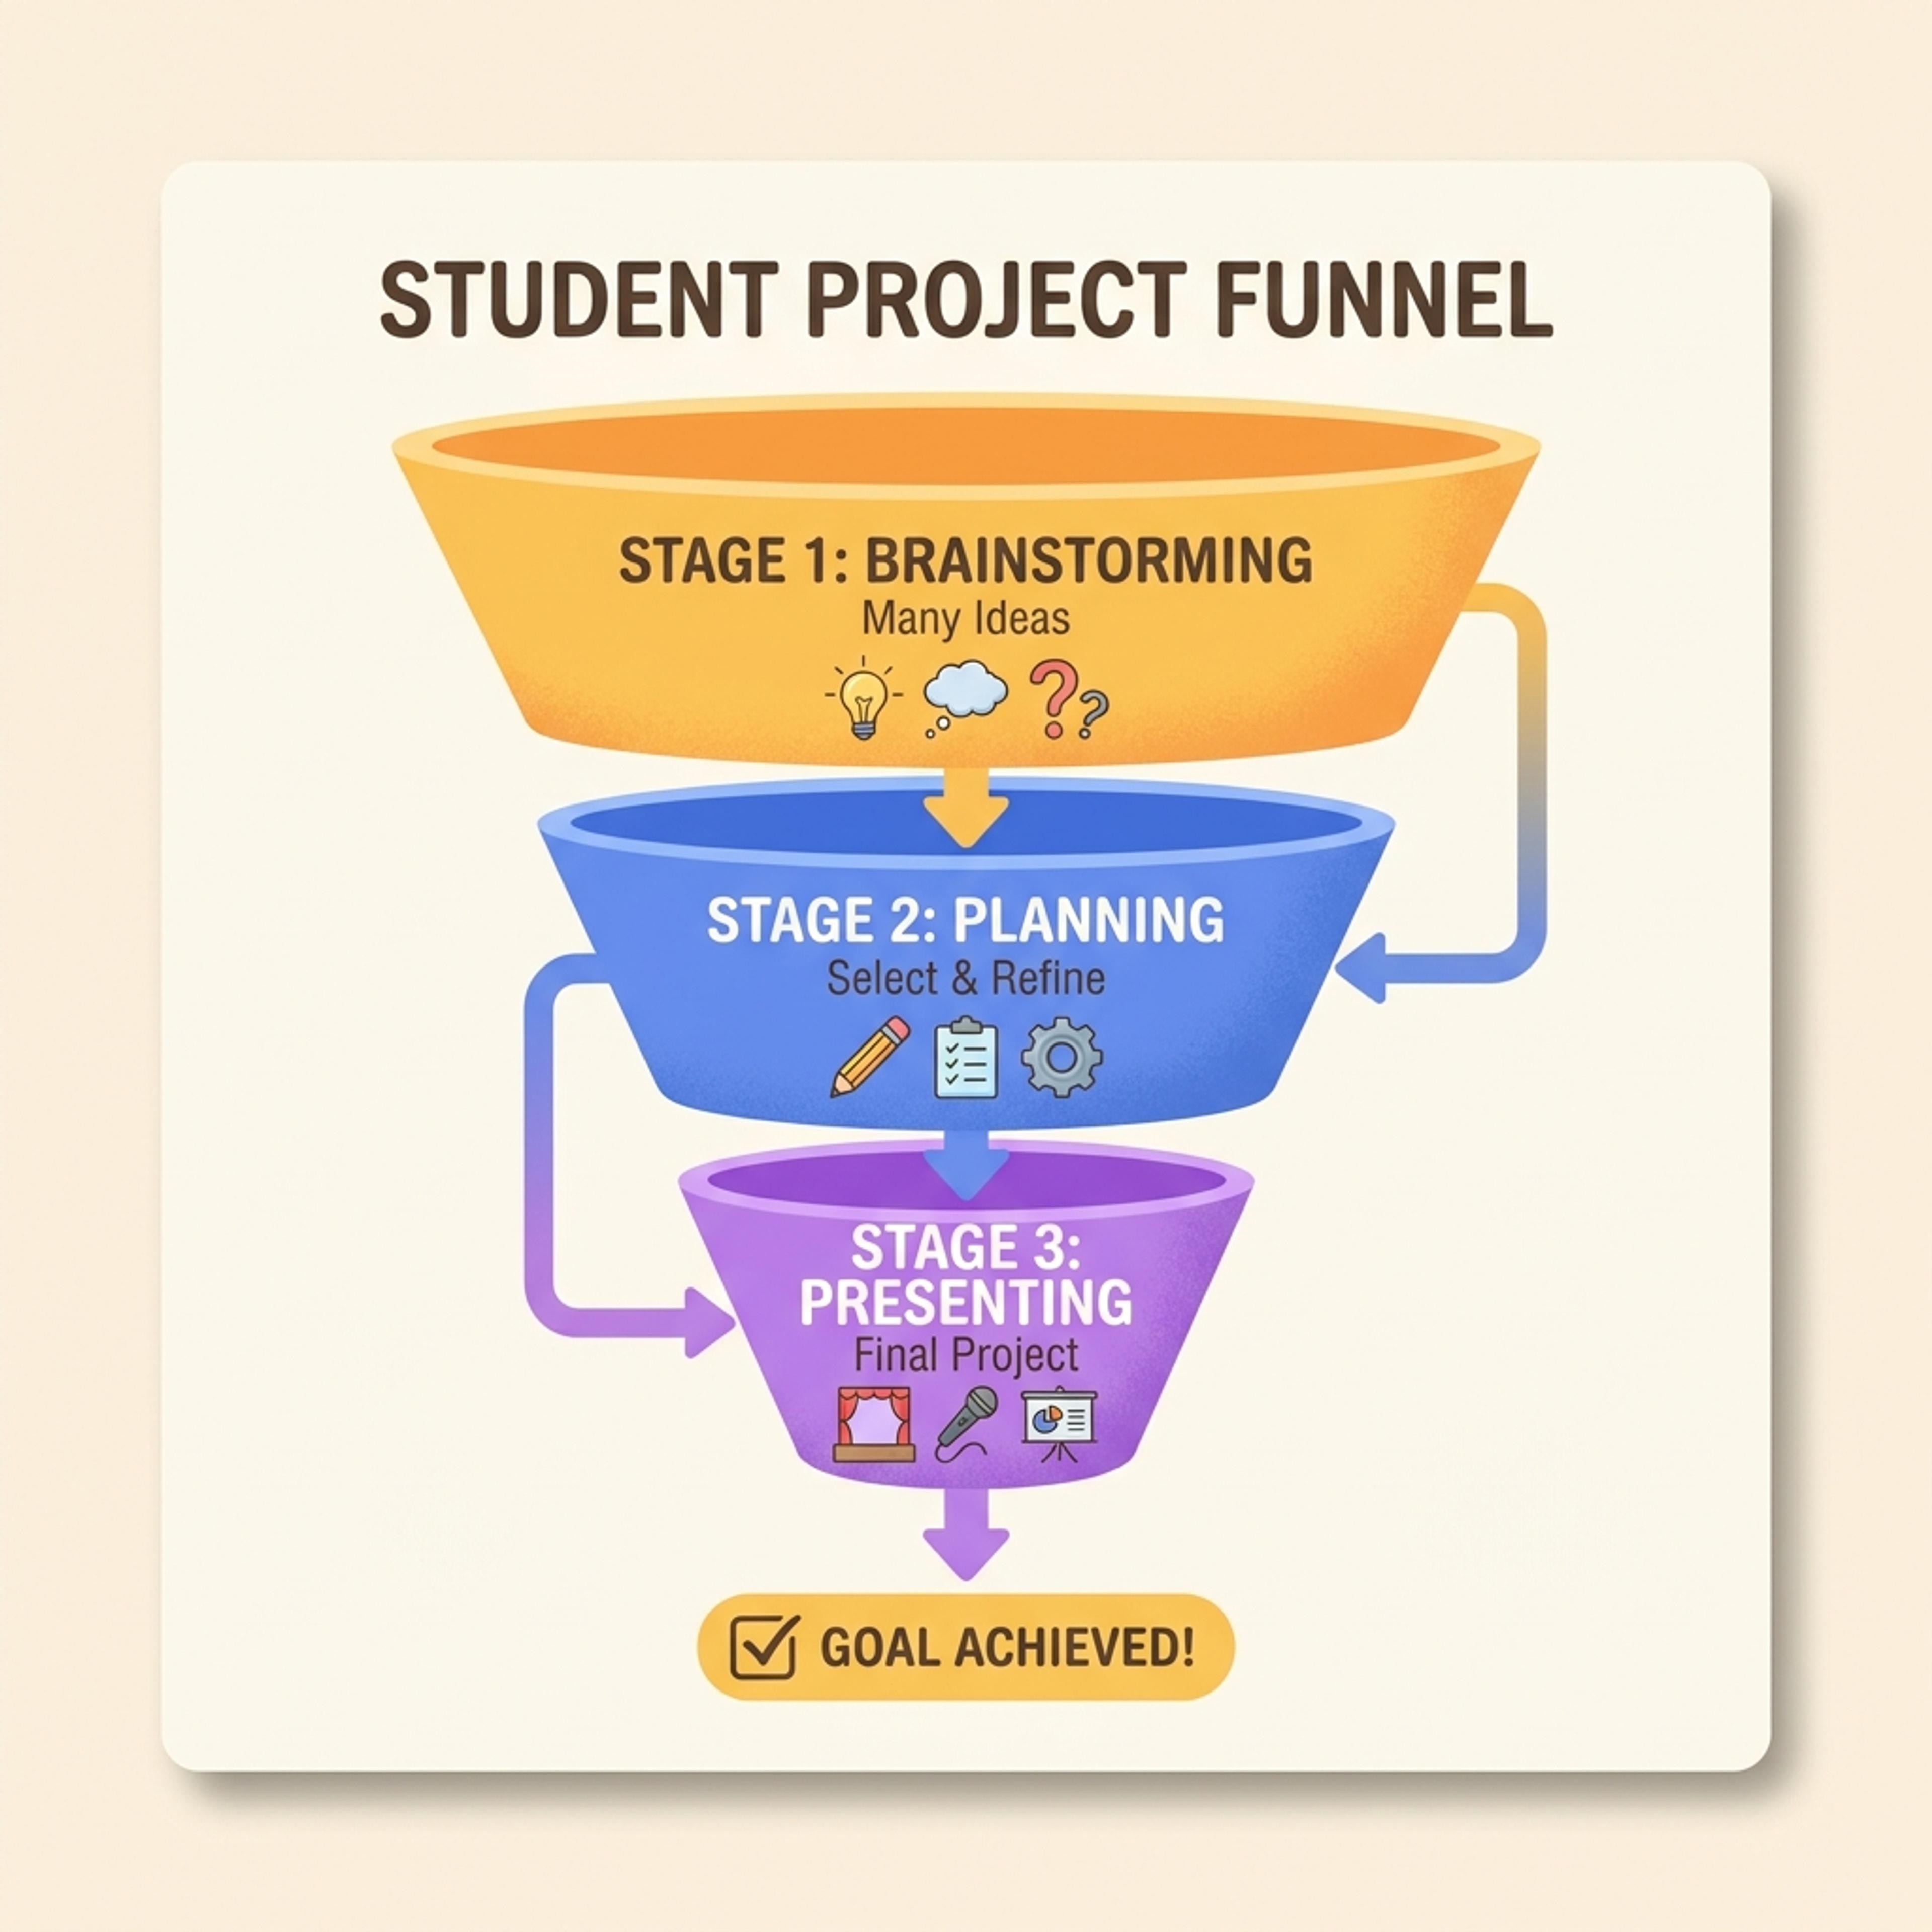
A funnel chart shows how a group narrows across stages, making it useful for conversion, selection, qualification, and process drop-off.
Use this format when each stage narrows the audience, pipeline, candidate pool, or set of options.
Turn signup, sales, hiring, onboarding, or review stages into a funnel that shows what happens at each step.
Make it easier to discuss where people, deals, candidates, or requests are falling out of the process.
Bring the funnel into growth reviews, hiring updates, sales meetings, onboarding analysis, or launch postmortems.
Give AI the stages and context, then check the numbers and labels before presenting.
List the funnel stages, such as visitors to signups, leads to customers, candidates to hires, or accounts to activation.
Add counts, percentages, or notes about what changes at each stage so the visual has useful context.
Review the stage order, verify the values, and call out the drop-off that matters most for the audience.
Use funnel visuals to explain staged drop-off, qualification, pipeline movement, and process narrowing.
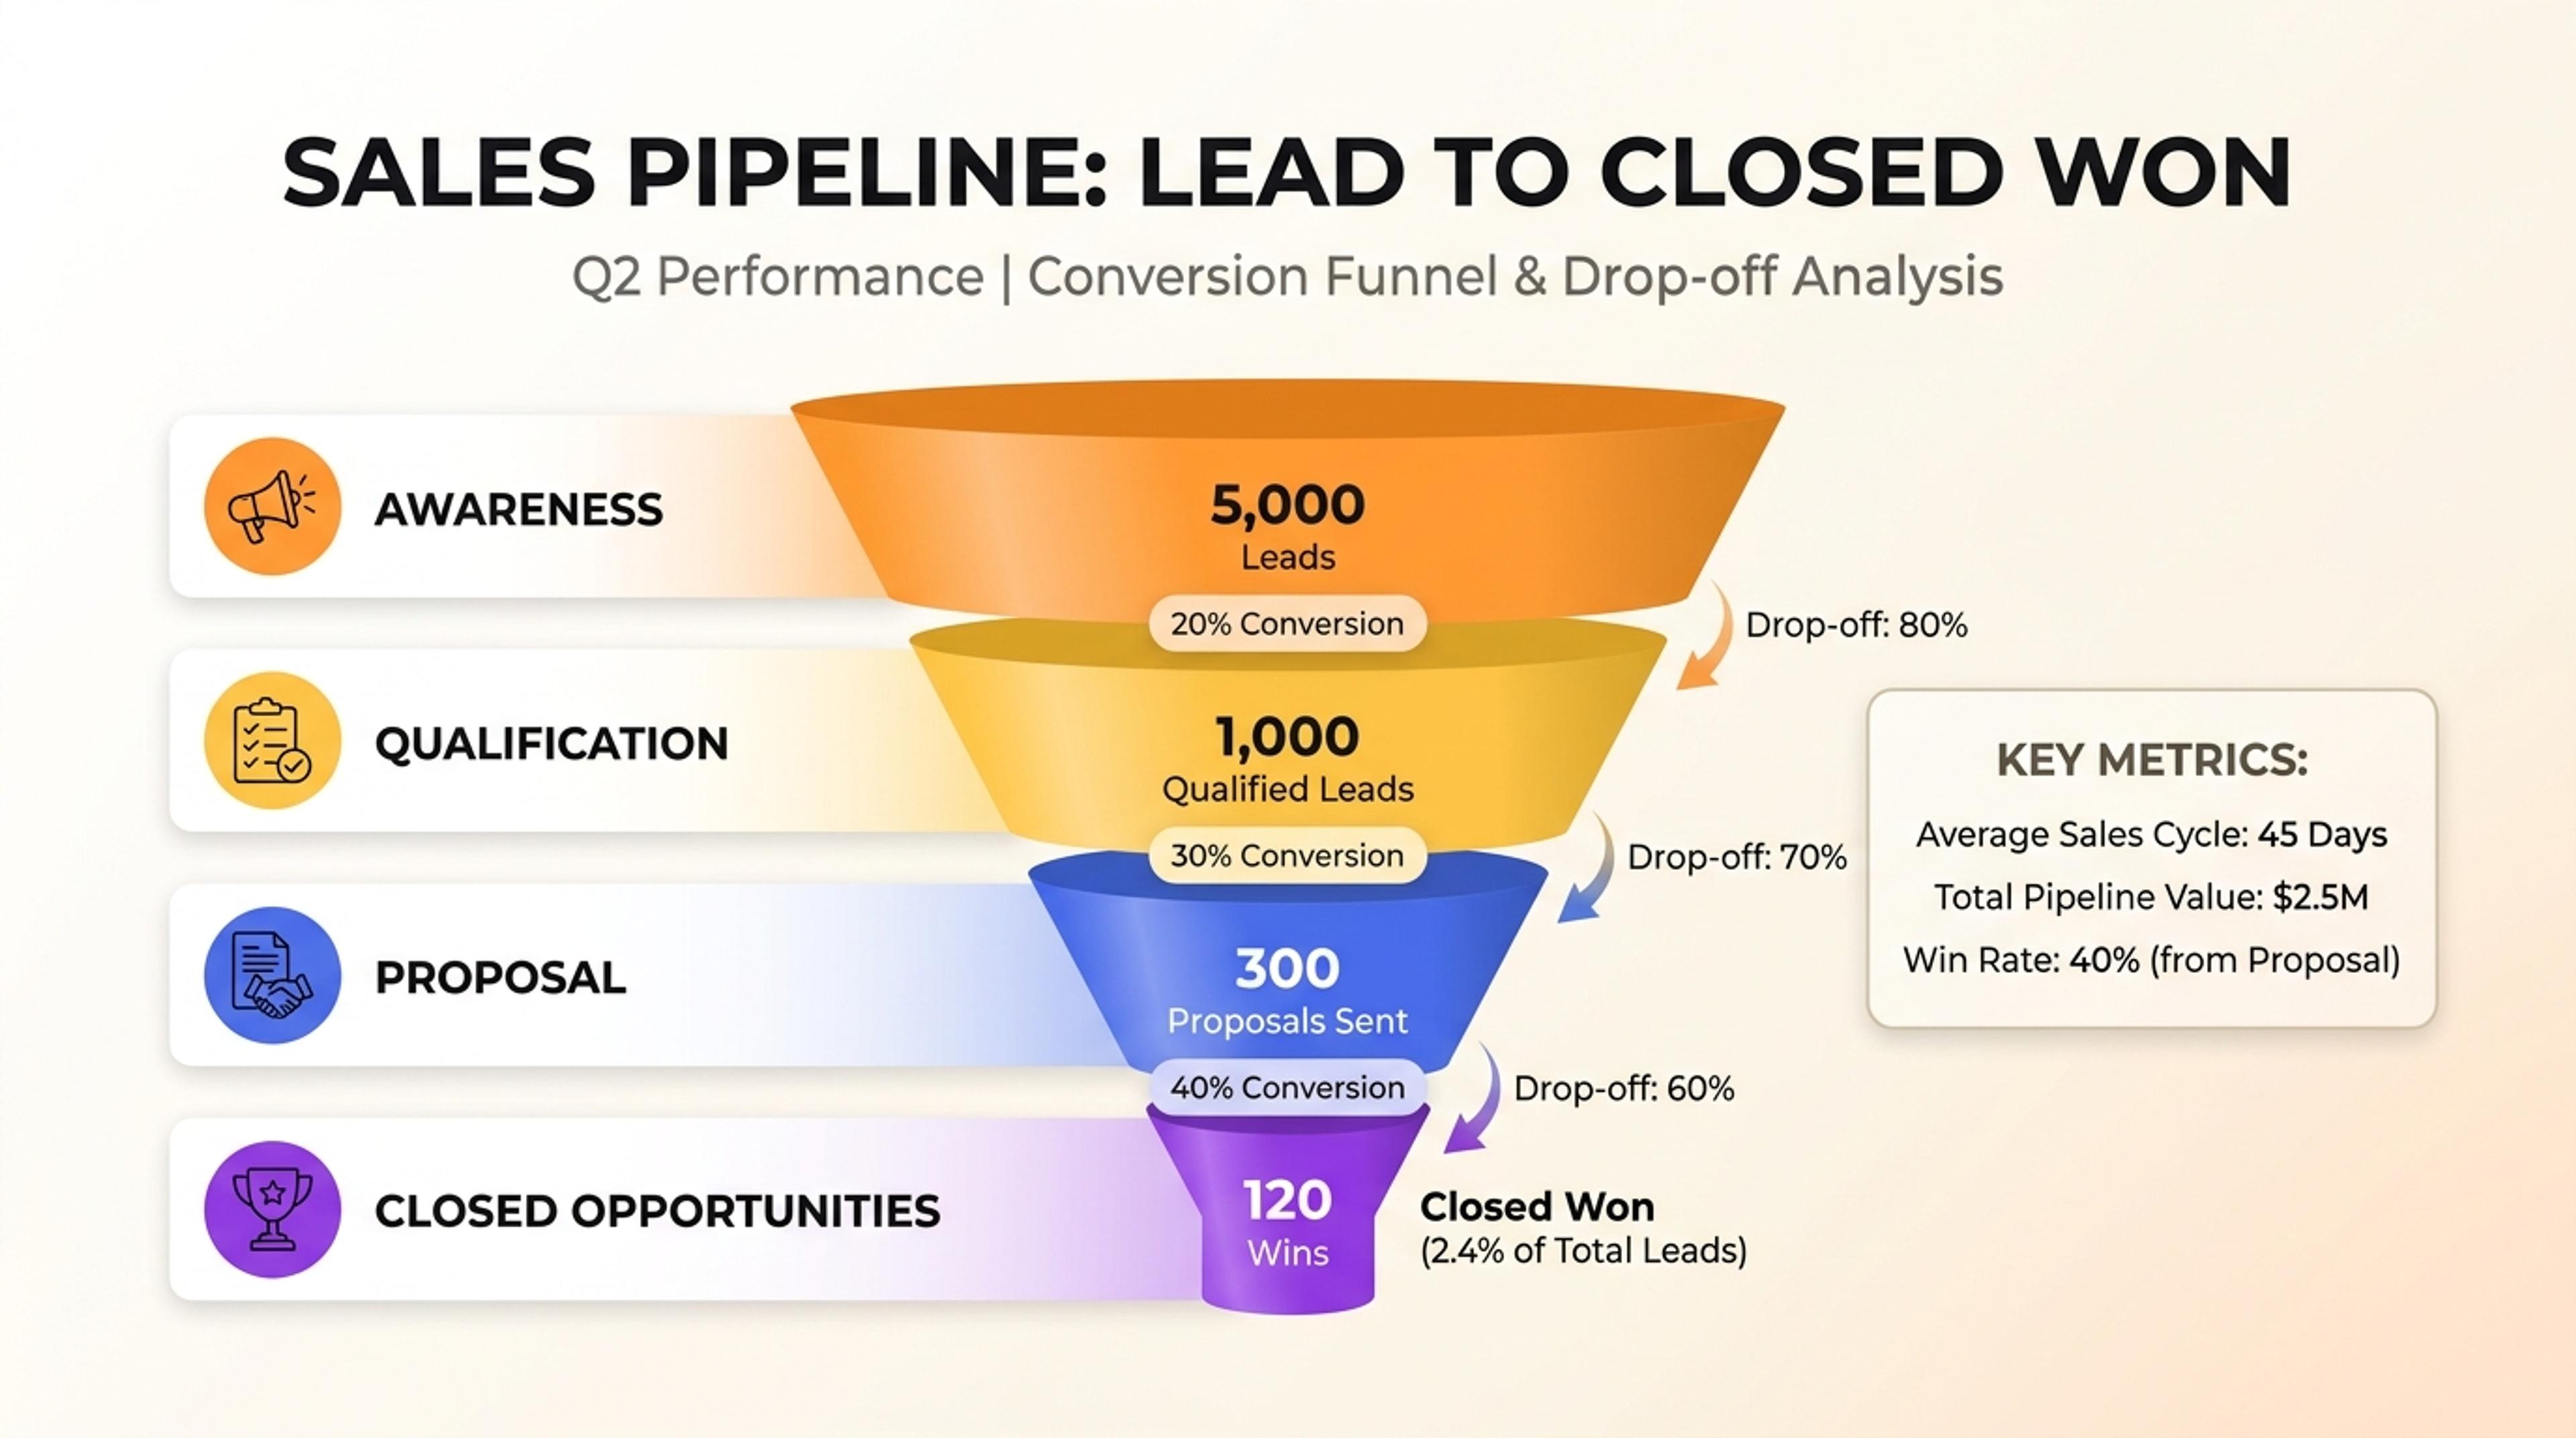
A funnel slide that shows leads moving from awareness to qualification, proposal, and closed opportunities.
Include each stage in order, plus counts or percentages if you have them. You can also add notes about what qualifies someone for the next stage.
Yes. Provide stages such as lead, qualified opportunity, proposal, negotiation, and closed won, then verify the values before sharing.
Yes, for a conceptual funnel. For performance reporting, exact counts or percentages are better and should be checked carefully.
Use a funnel when the main point is narrowing or drop-off. Use a timeline when the main point is when things happen.
Yes. You can rename stages, reorder them, add missing context, and adjust the emphasis before using the chart in a deck.
Use these formats when your funnel needs a timeline, cycle, cause analysis, or strategic context.
Turn topics, notes, documents, and links into editable visuals for slide decks, lessons, reports, and planning conversations.
Turn events, milestones, roadmap phases, project plans, and historical sequences into a slide-ready timeline.
Show linear workflows, handoffs, intake processes, and delivery stages as a clean pipe process diagram.
Show cycles, recurring workflows, feedback loops, and continuous improvement processes as a clear circular visual.
Turn a problem statement, notes, documents, or links into an editable Ishikawa diagram for root-cause analysis and PowerPoint.
Add your funnel stages, counts, or process notes and turn them into an editable chart for your deck.