


Map the path from input to output
Turn operating notes, onboarding steps, support escalations, or delivery workflows into a linear visual.
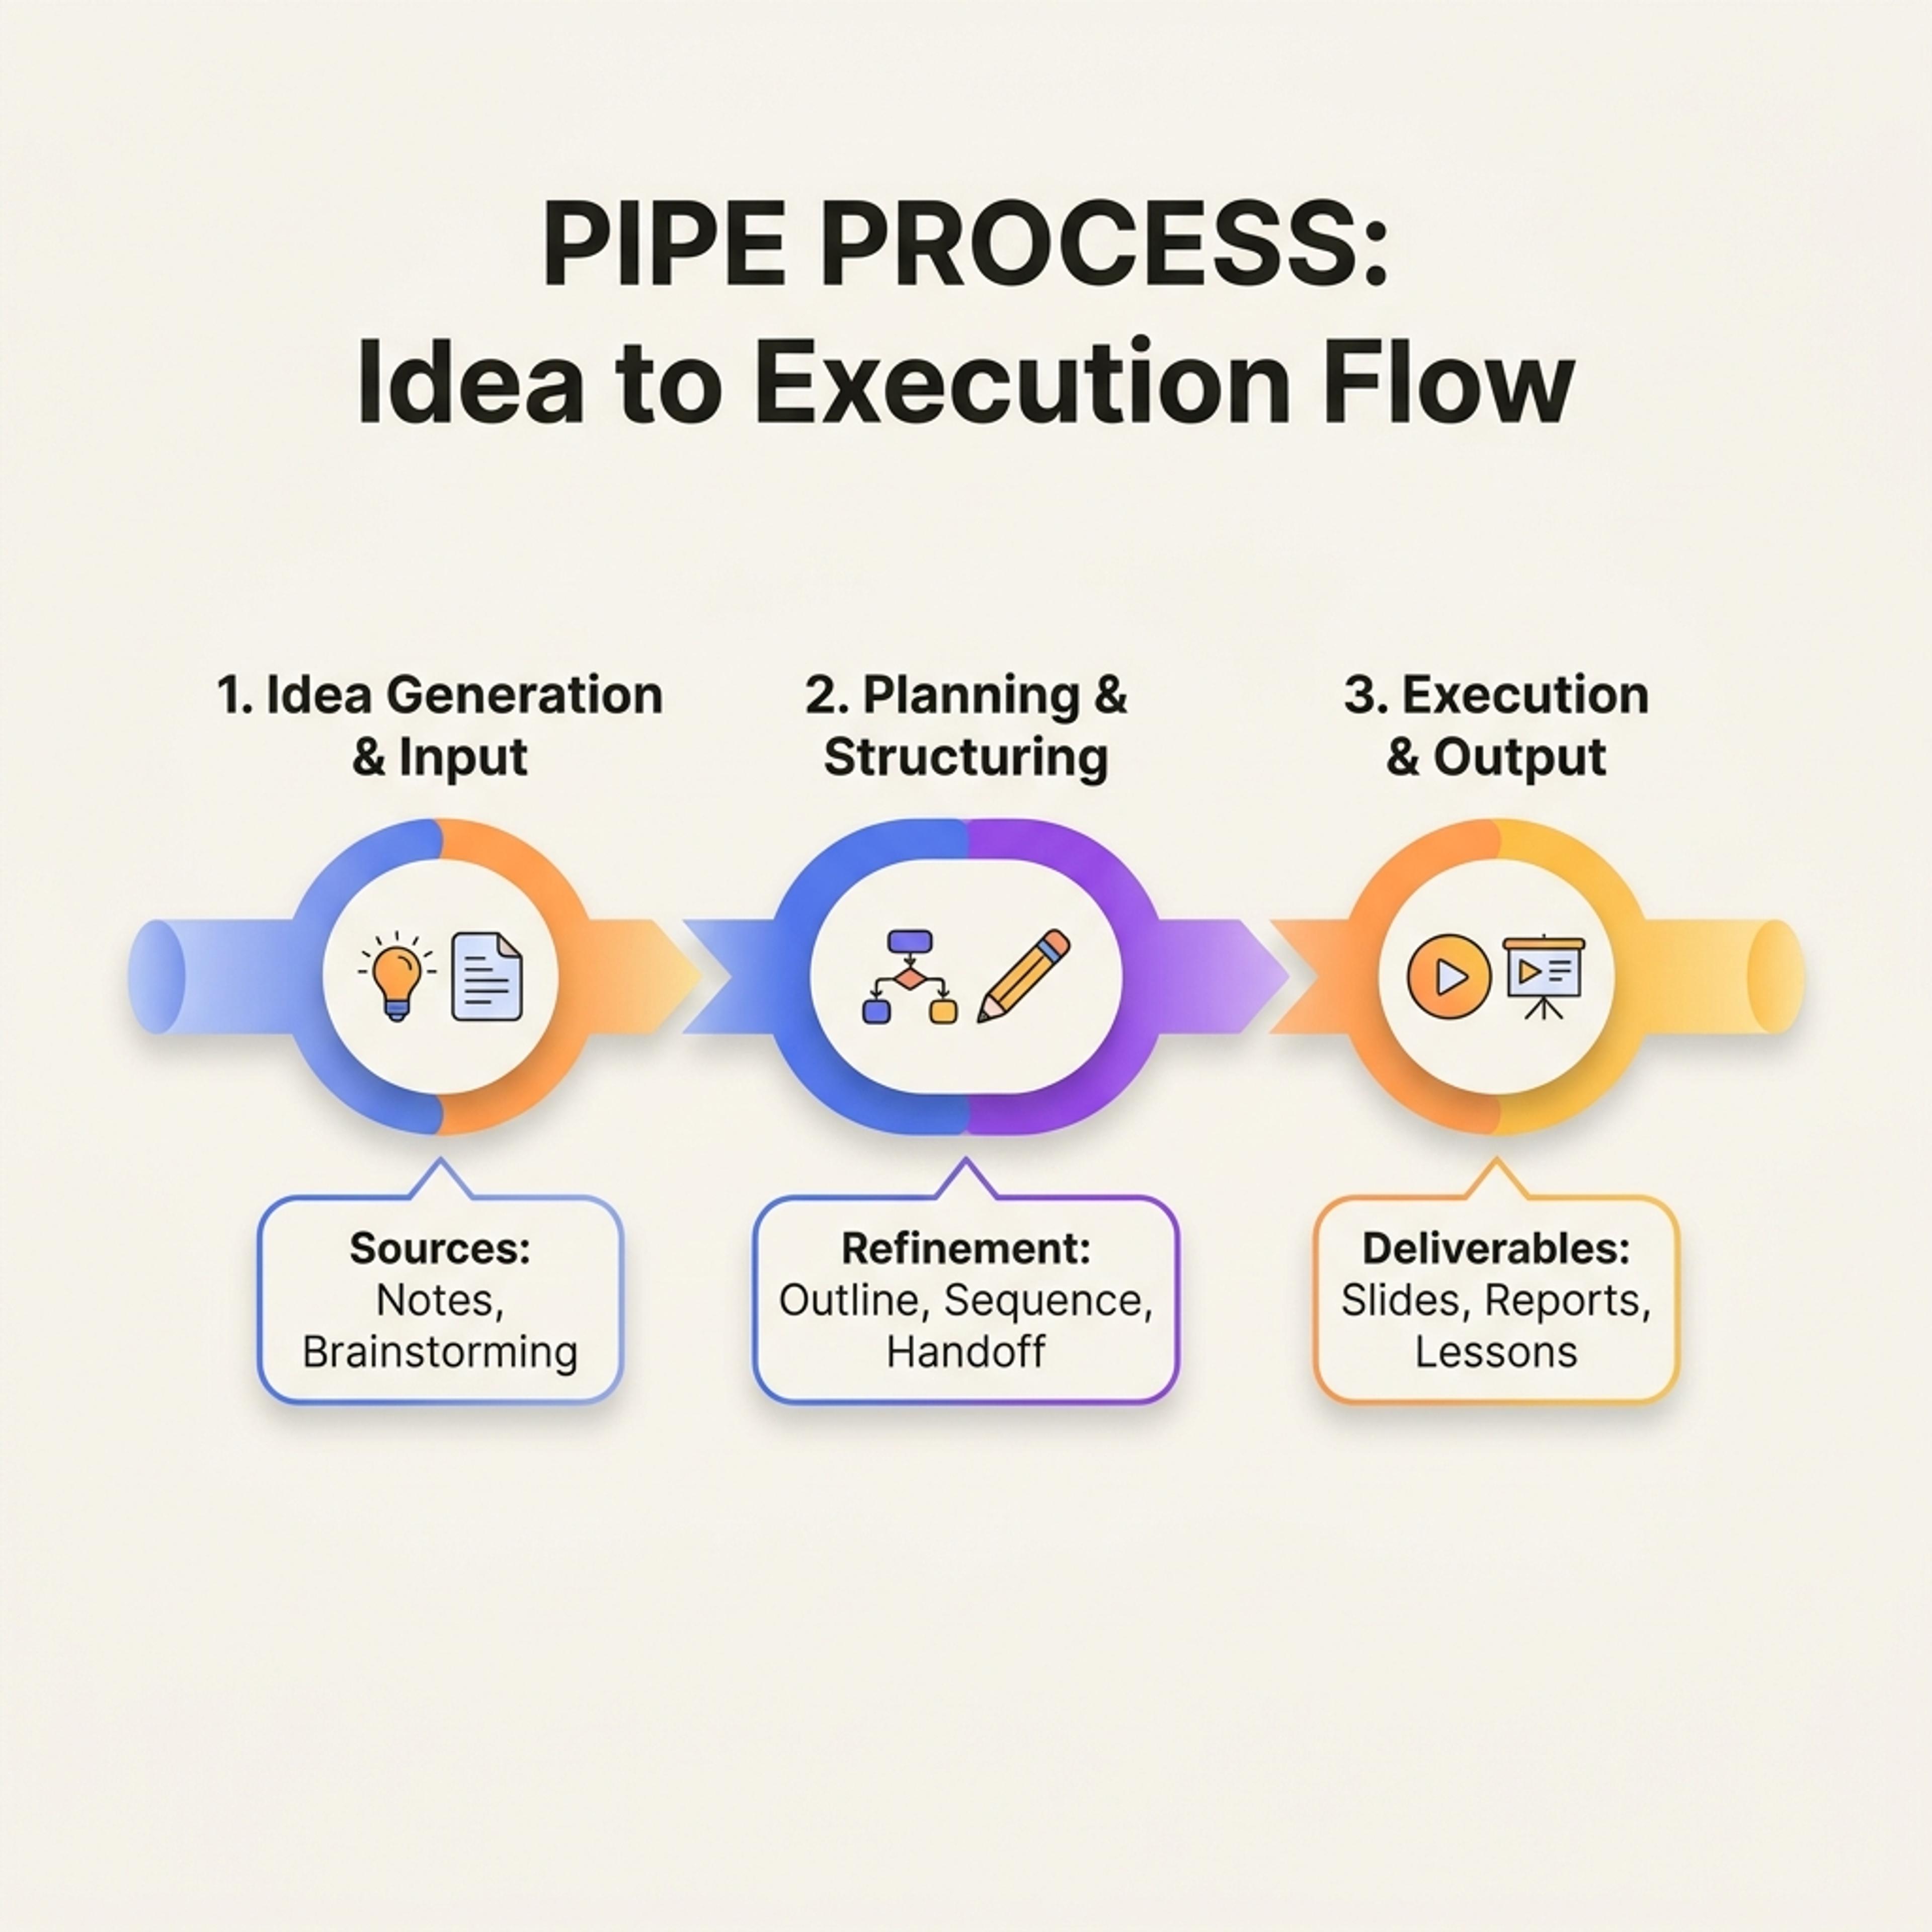
Show linear workflows, handoffs, intake processes, and delivery stages as a clean pipe process diagram.
Drag & drop your file here or
A pipe process diagram shows how work moves from one stage to the next, making handoffs, bottlenecks, and outputs easier to discuss.
Use this format when a process moves through clear stages and each handoff matters.
Turn operating notes, onboarding steps, support escalations, or delivery workflows into a linear visual.
Show where work changes owners, where information is added, and where bottlenecks may appear.
Bring the process into onboarding decks, SOP reviews, client kickoffs, operations updates, or improvement workshops.
Give AI the workflow stages and handoffs, then simplify the process into a slide people can follow.
List the workflow stages from intake to final output, including the handoffs or decisions between them.
Add context about owners, inputs, or pain points so the generated process reflects the real workflow.
Review the sequence, remove unnecessary detail, and make sure each stage label is short enough for a slide.
Use pipe process diagrams when work moves through connected stages, handoffs, or transformations.
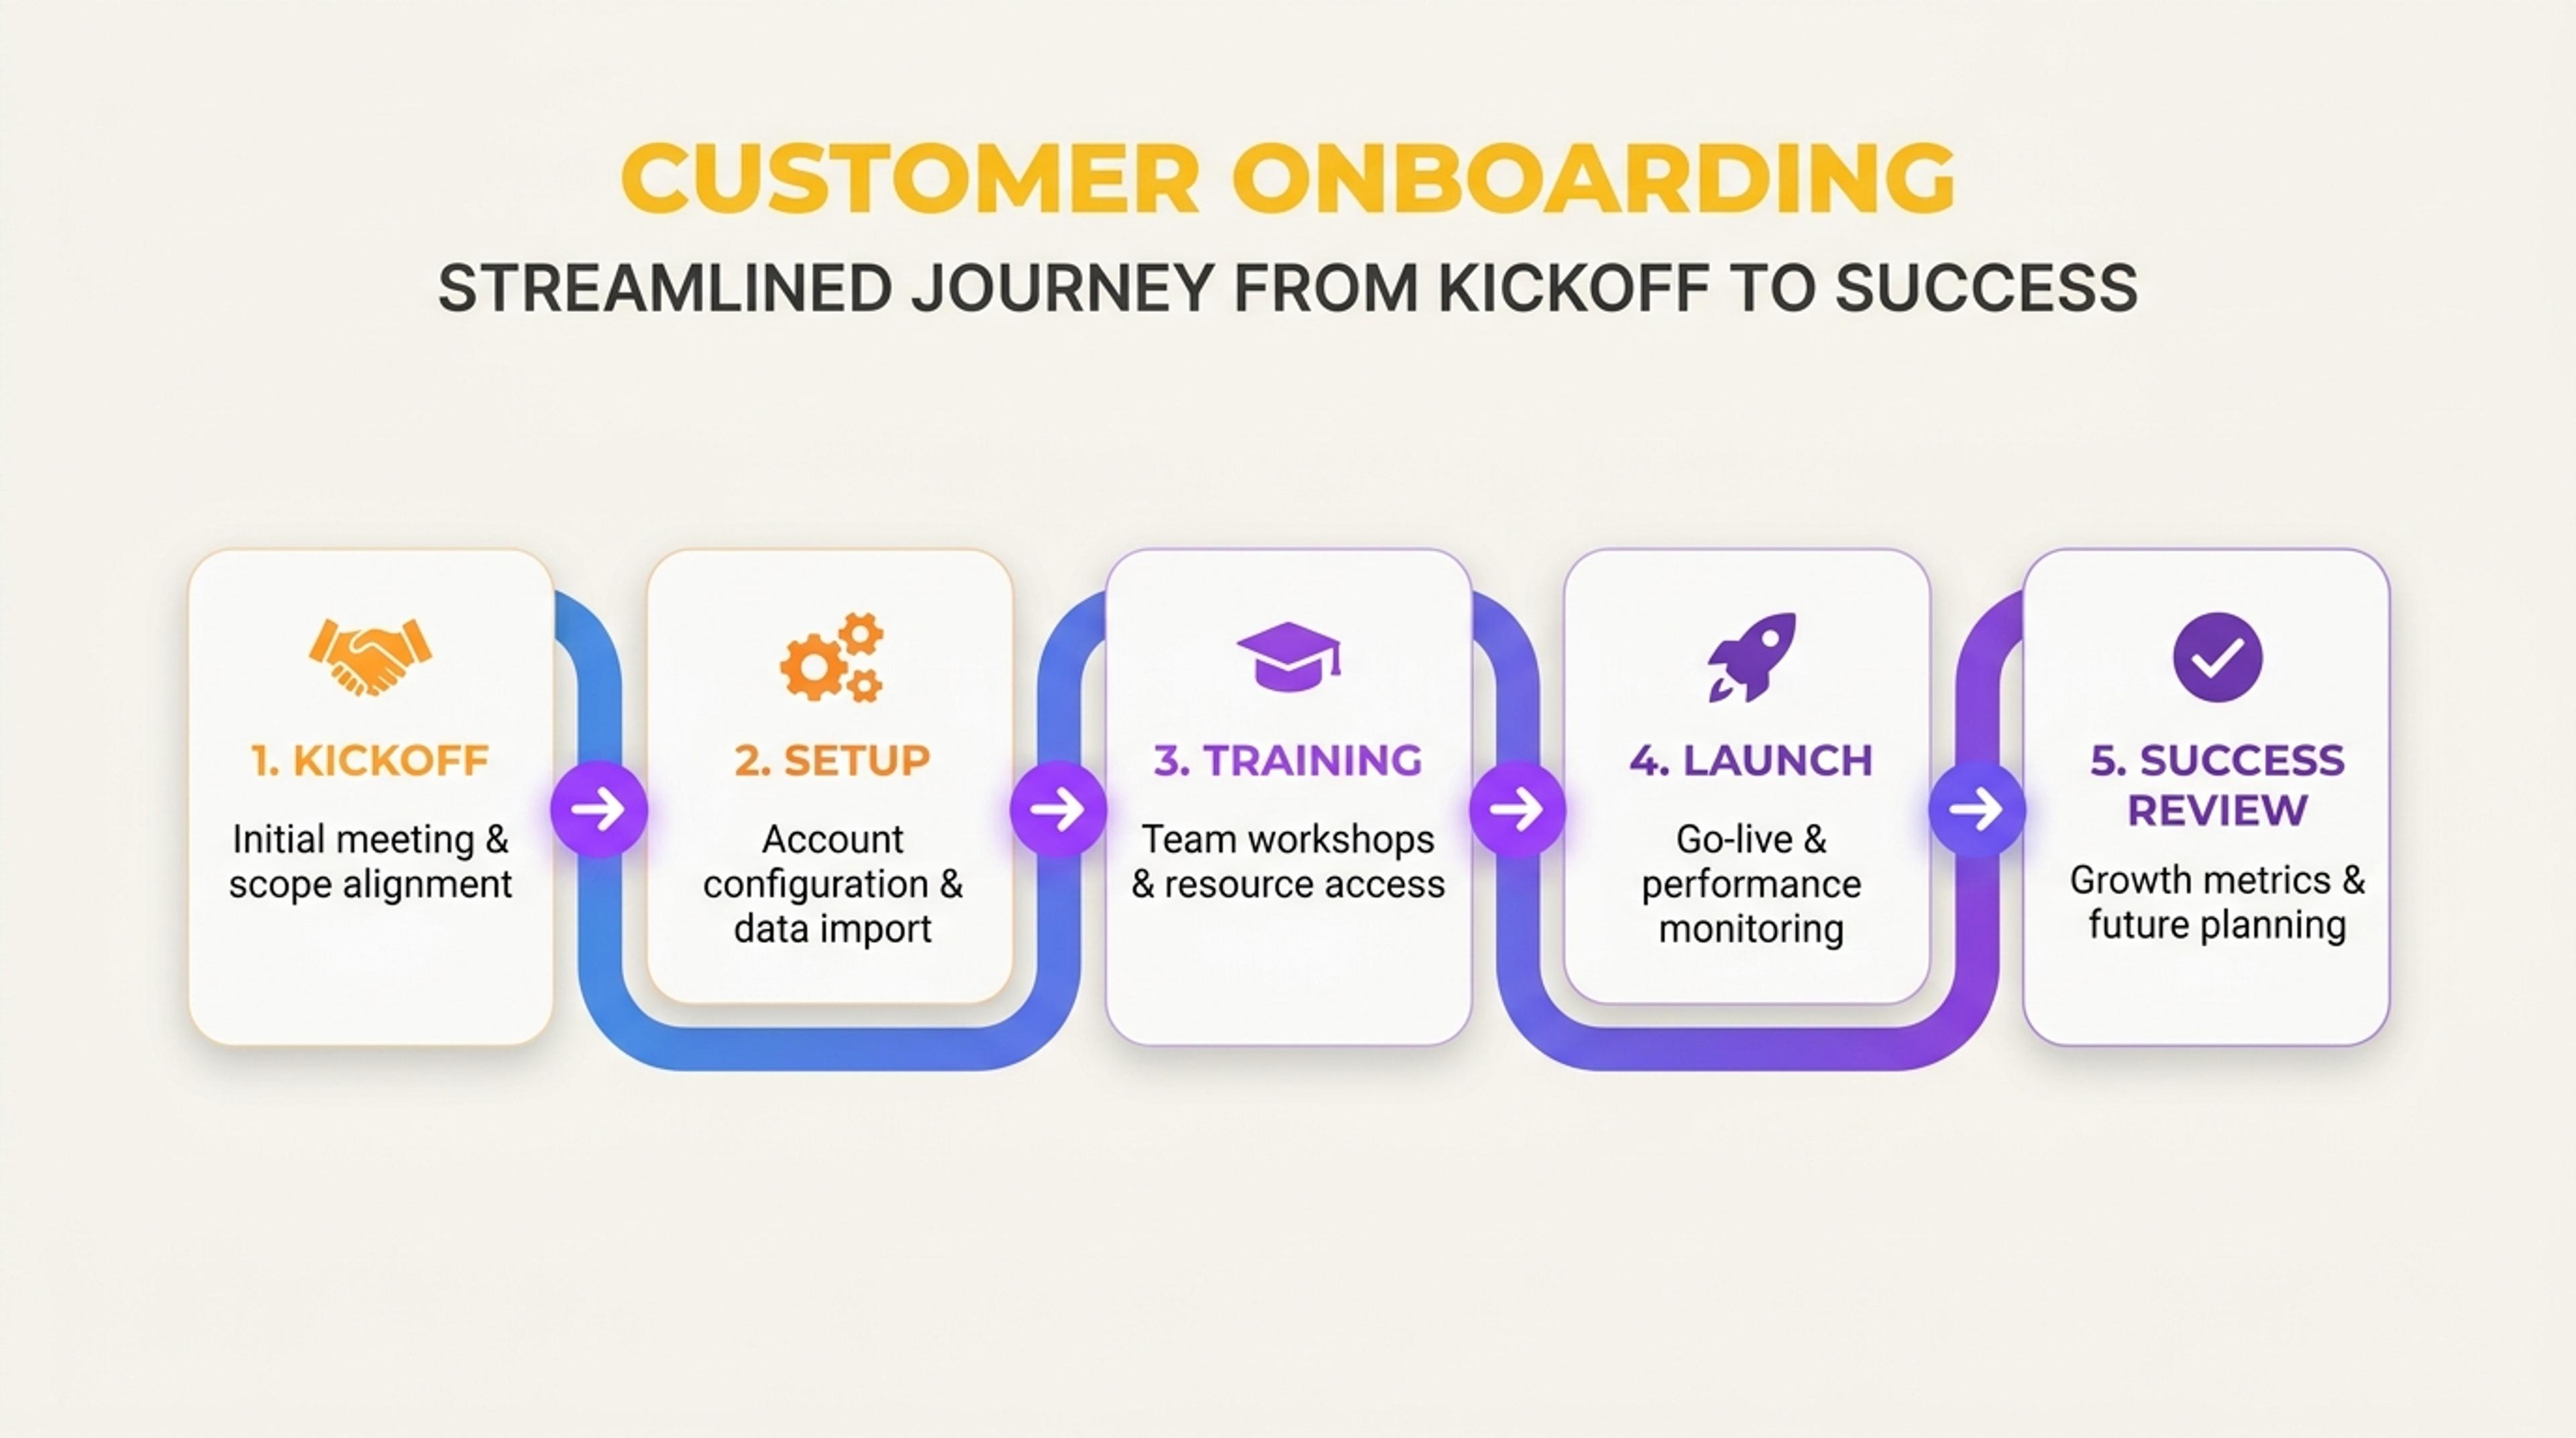
A process slide showing how a customer moves from kickoff to setup, training, launch, and success review.
Use it for a mostly linear workflow where inputs move through stages toward an output. It is especially useful for handoffs and operational processes.
Yes. Include notes about delays or pain points, then highlight the stage where the bottleneck occurs in the final slide.
A timeline emphasizes when things happen. A pipe process emphasizes how work moves through stages and handoffs.
Yes. Pipe process diagrams work well for client onboarding, employee onboarding, service delivery, and support escalation flows.
Yes. The generated draft should be reviewed so the stage names match your team's actual language.
Use these formats when a linear process needs a timeline, cycle, funnel, or cause-and-effect view.
Turn topics, notes, documents, and links into editable visuals for slide decks, lessons, reports, and planning conversations.
Turn events, milestones, roadmap phases, project plans, and historical sequences into a slide-ready timeline.
Show cycles, recurring workflows, feedback loops, and continuous improvement processes as a clear circular visual.
Turn a problem statement, notes, documents, or links into an editable Ishikawa diagram for root-cause analysis and PowerPoint.
Visualize conversion stages, selection processes, sales pipelines, recruiting steps, and drop-off points in a funnel chart.
Paste workflow notes or process stages and turn them into an editable pipe process visual.