


Show the loop, not just the steps
Turn notes about recurring work, feedback, planning cycles, or improvement loops into a diagram that clearly returns to the beginning.
Show cycles, recurring workflows, feedback loops, and continuous improvement processes as a clear circular visual.

Drag & drop your file here or
A circular diagram shows a process that repeats, returns to the start, or improves over time, making it useful for operating rhythms and feedback loops.
Use this format when the point is repetition, renewal, or continuous movement rather than a one-way process.
Turn notes about recurring work, feedback, planning cycles, or improvement loops into a diagram that clearly returns to the beginning.
Use a circular layout for customer feedback, campaign planning, product discovery, learning cycles, or quarterly operating rhythms.
Help the audience see how each pass through the loop creates learning, refinement, or better decisions.
Describe the recurring process, then refine the loop so each stage leads naturally to the next.
Paste or describe the cycle you want to show, including the starting point and what brings the process back around.
Add context about the audience and whether the cycle is for operations, marketing, learning, product work, or strategy.
Review the order, merge duplicate stages, and make sure the final step clearly feeds back into the first.
Use circular diagrams to explain cycles, feedback loops, improvement systems, and repeatable operating rhythms.
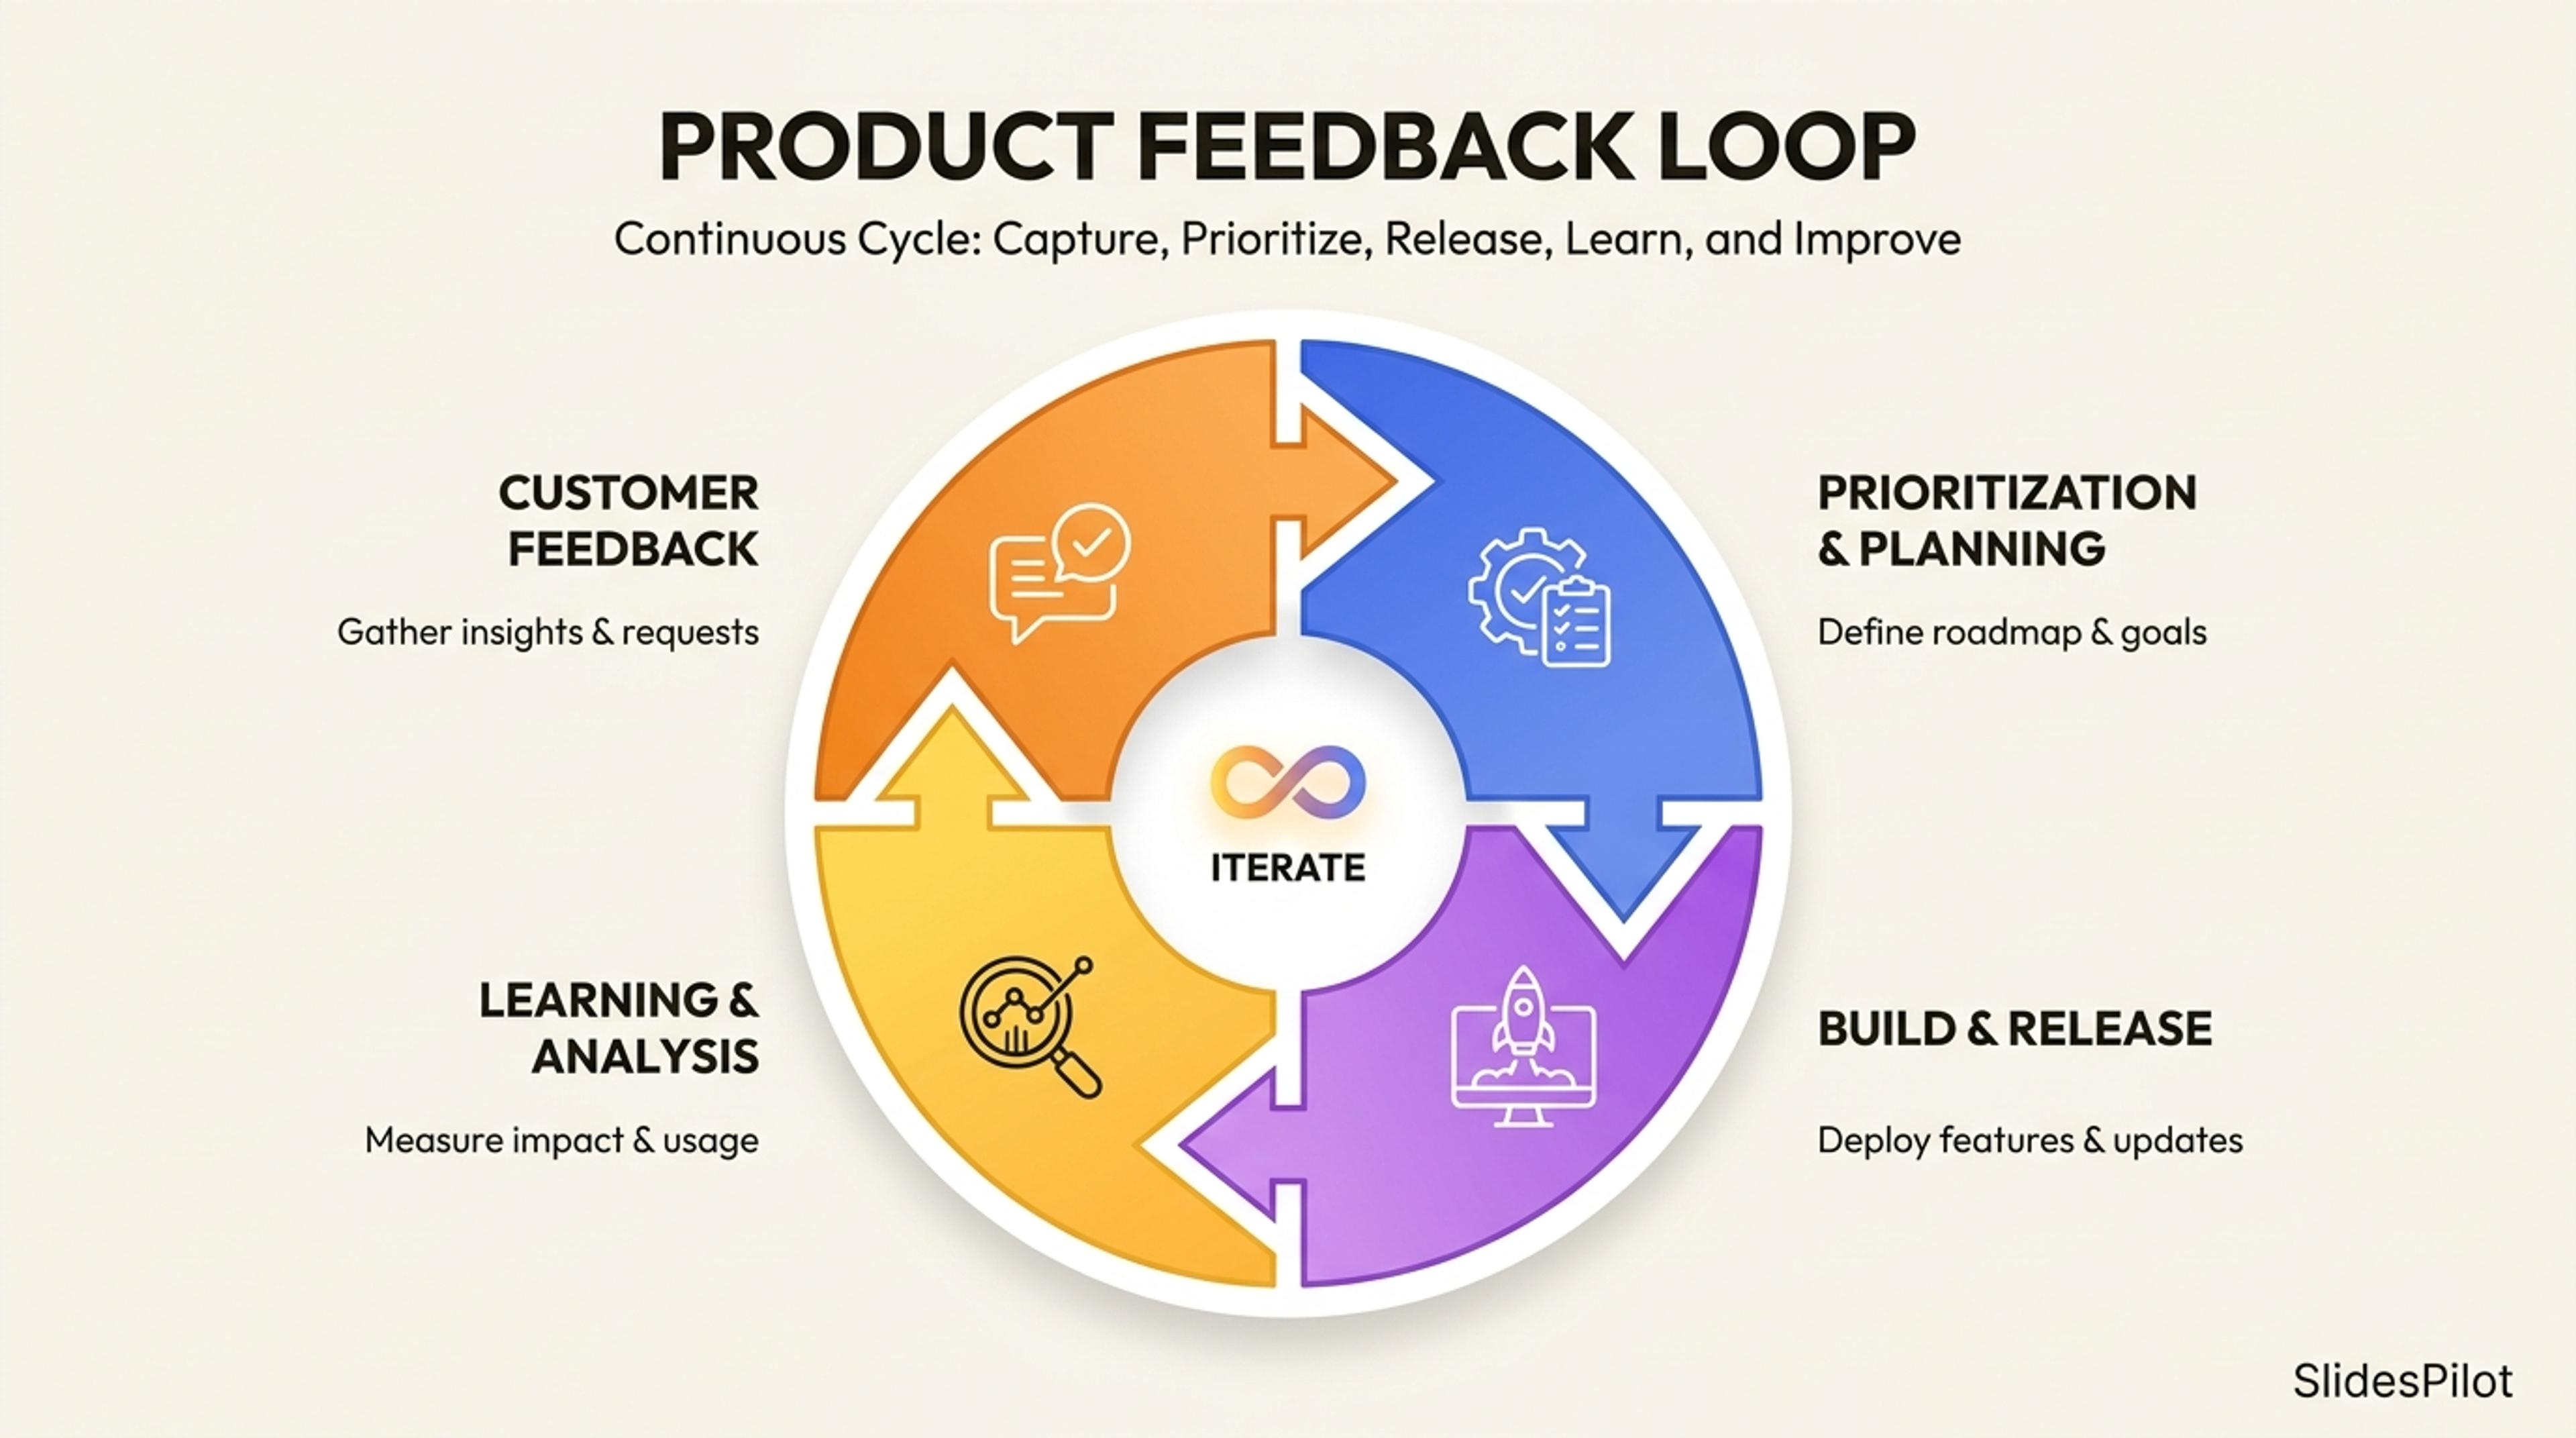
A cycle slide showing how feedback, prioritization, release, and learning connect across product work.
Use it when the process repeats or improves over time. If the work simply moves from start to finish, a timeline or pipe process may be clearer.
Yes. Include the inputs, actions, learning points, and next cycle so the generated diagram shows how feedback changes future work.
Most presentation slides work best with four to six stages. More than that can become hard to read unless the labels are very short.
Yes. The generated draft should be reviewed and adjusted so the loop matches the real process your team uses.
Describe the process, the audience, and the outcome of the cycle. If you already have stage names, include them.
Use these formats when a circular loop needs to become a process, timeline, funnel, or cause-and-effect slide.
Turn topics, notes, documents, and links into editable visuals for slide decks, lessons, reports, and planning conversations.
Turn events, milestones, roadmap phases, project plans, and historical sequences into a slide-ready timeline.
Show linear workflows, handoffs, intake processes, and delivery stages as a clean pipe process diagram.
Turn a problem statement, notes, documents, or links into an editable Ishikawa diagram for root-cause analysis and PowerPoint.
Visualize conversion stages, selection processes, sales pipelines, recruiting steps, and drop-off points in a funnel chart.
Describe your cycle, feedback loop, or recurring workflow and turn it into an editable visual.