


Compare without overexplaining
Turn notes about two or three concepts, audiences, products, theories, or constraints into a clean overlap visual.
Compare overlap, differences, shared traits, and strategic fit with an editable Venn diagram for slides.
Drag & drop your file here or
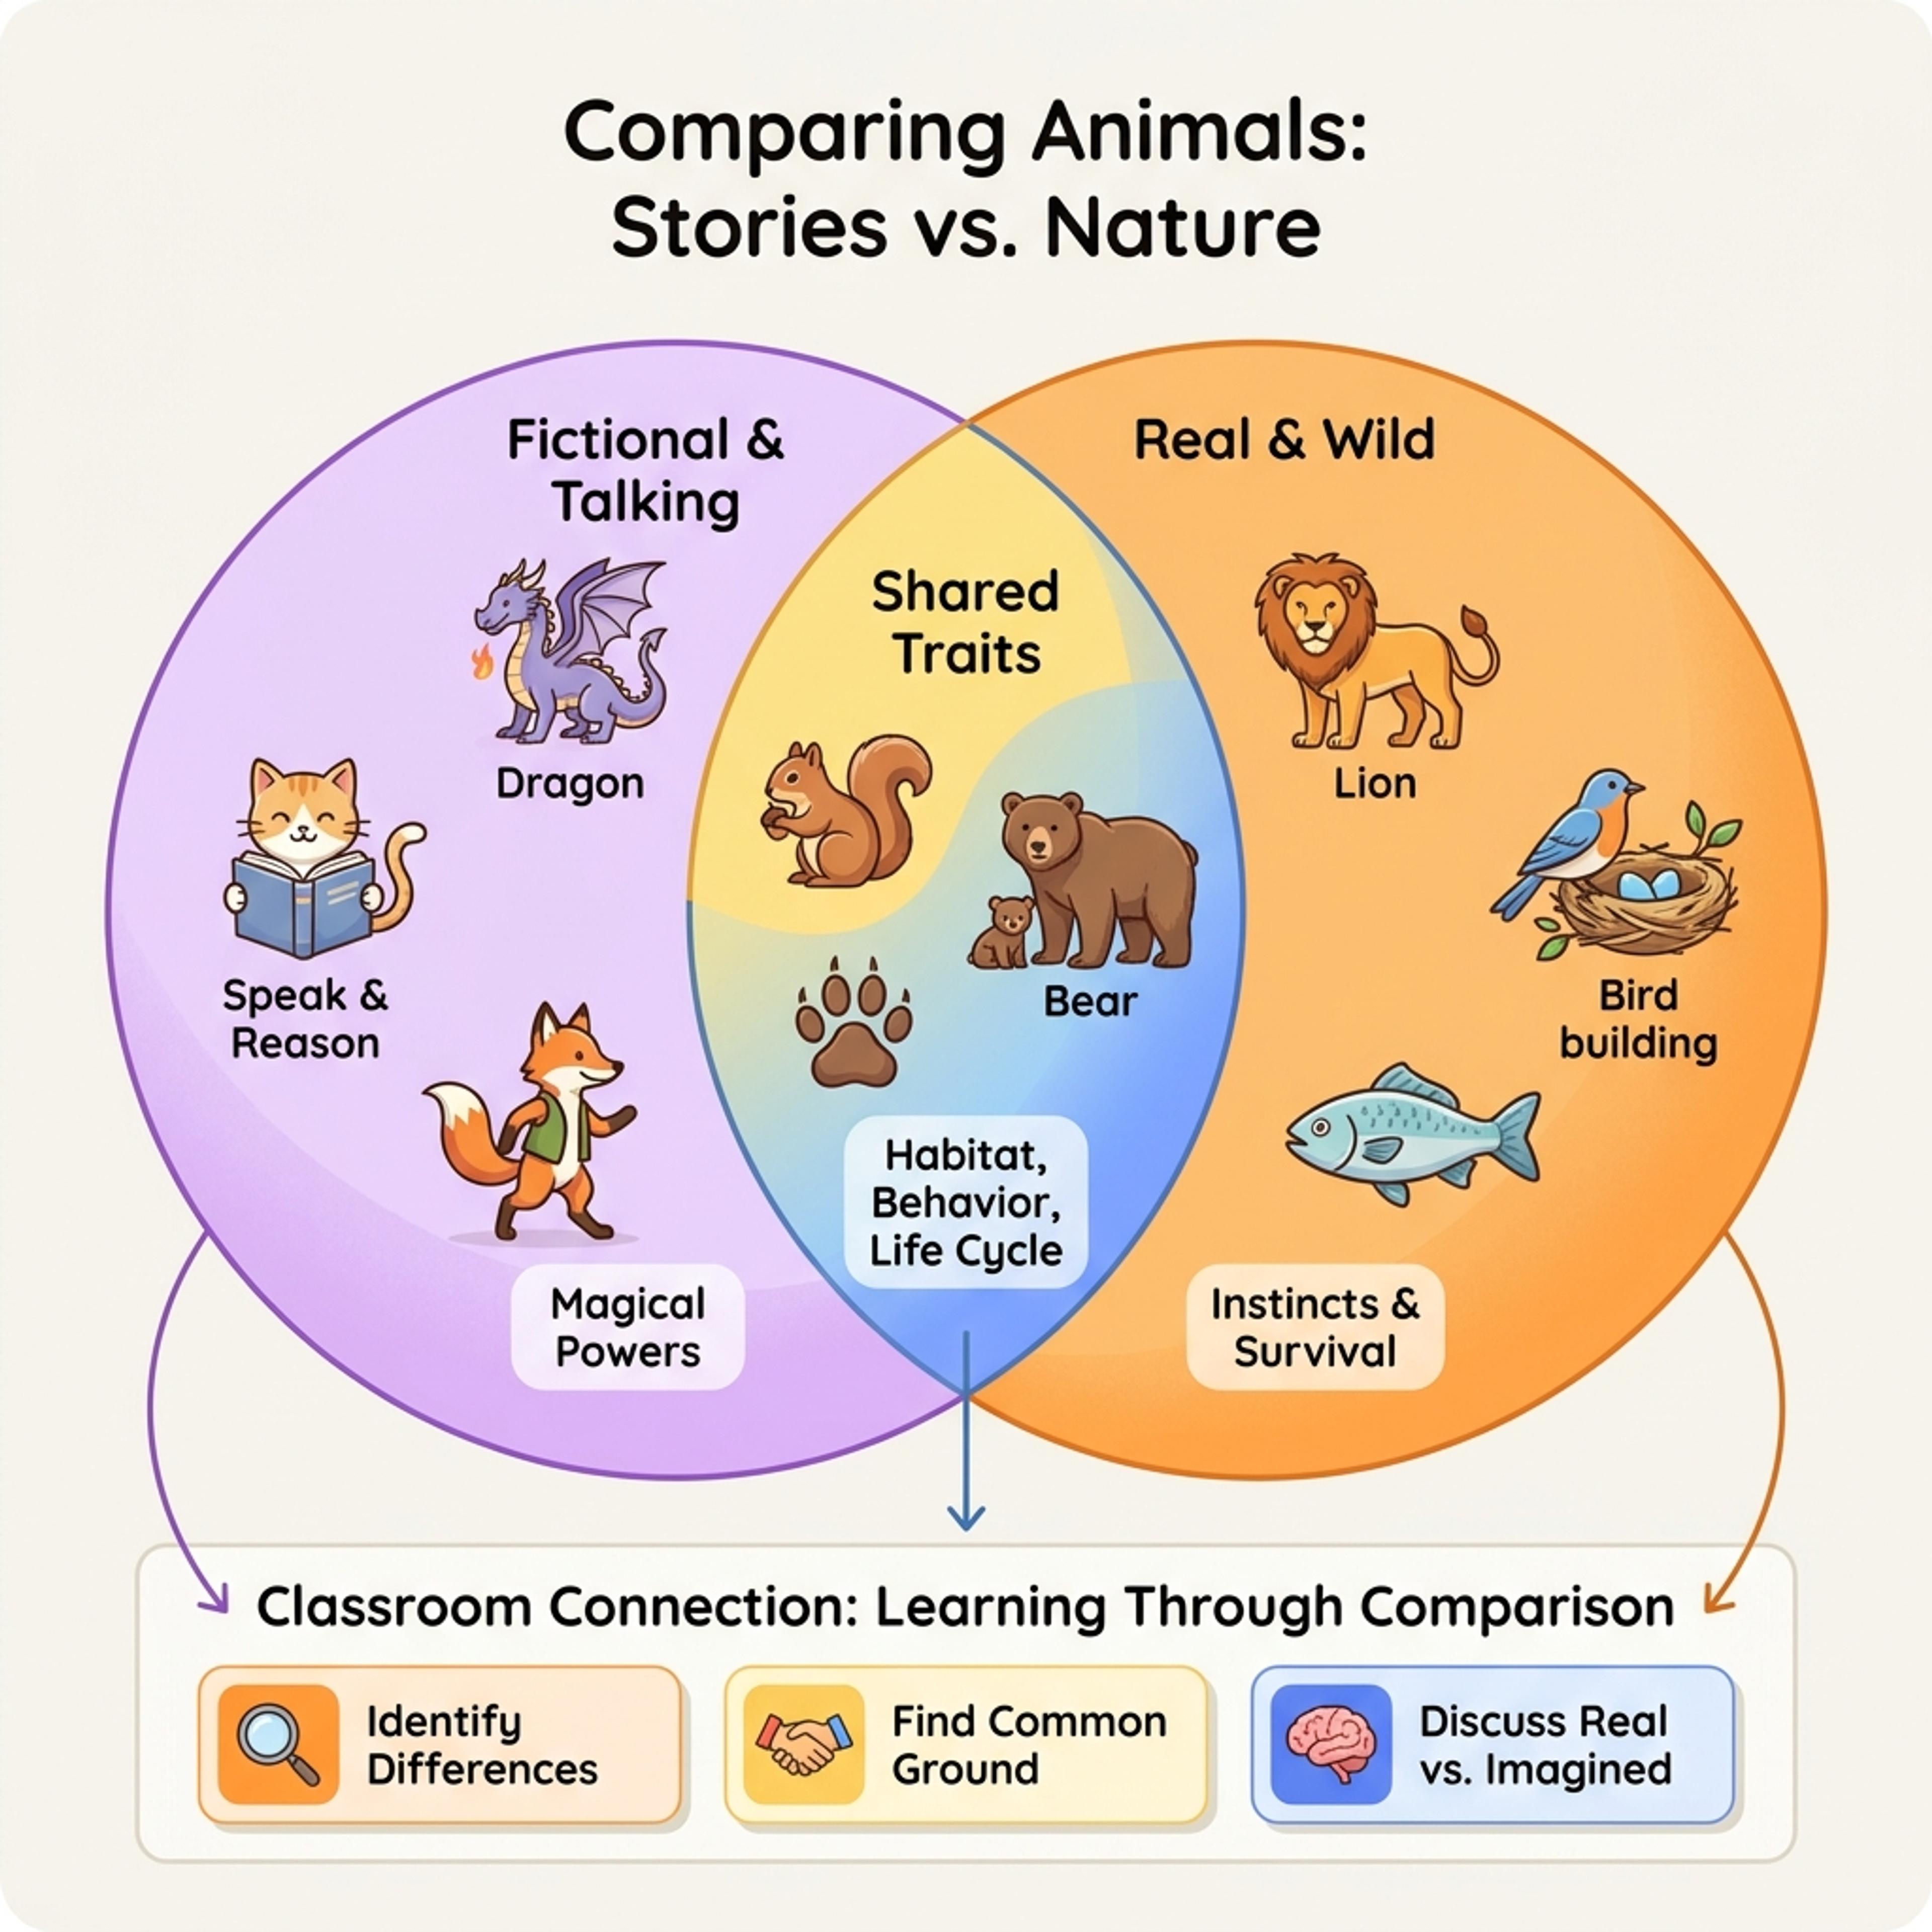
A Venn diagram shows what is shared and what is distinct, making it useful for comparisons, positioning, research themes, and audience overlap.
Use this format when the most important point sits between two or three ideas.
Turn notes about two or three concepts, audiences, products, theories, or constraints into a clean overlap visual.
Help the audience see what is unique, what overlaps, and why the middle matters.
Bring the diagram into product strategy, marketing, classroom comparisons, research synthesis, or client recommendations.
Provide the concepts you want to compare, then refine the overlap so it says something useful.
Name the two or three concepts, audiences, products, theories, or constraints you want to compare.
Add notes about what is unique to each side and what belongs in the overlap.
Review the middle carefully, remove vague claims, and make sure the overlap is meaningful for the presentation.
Use Venn diagrams when overlap, difference, and shared ground need to be clear at a glance.
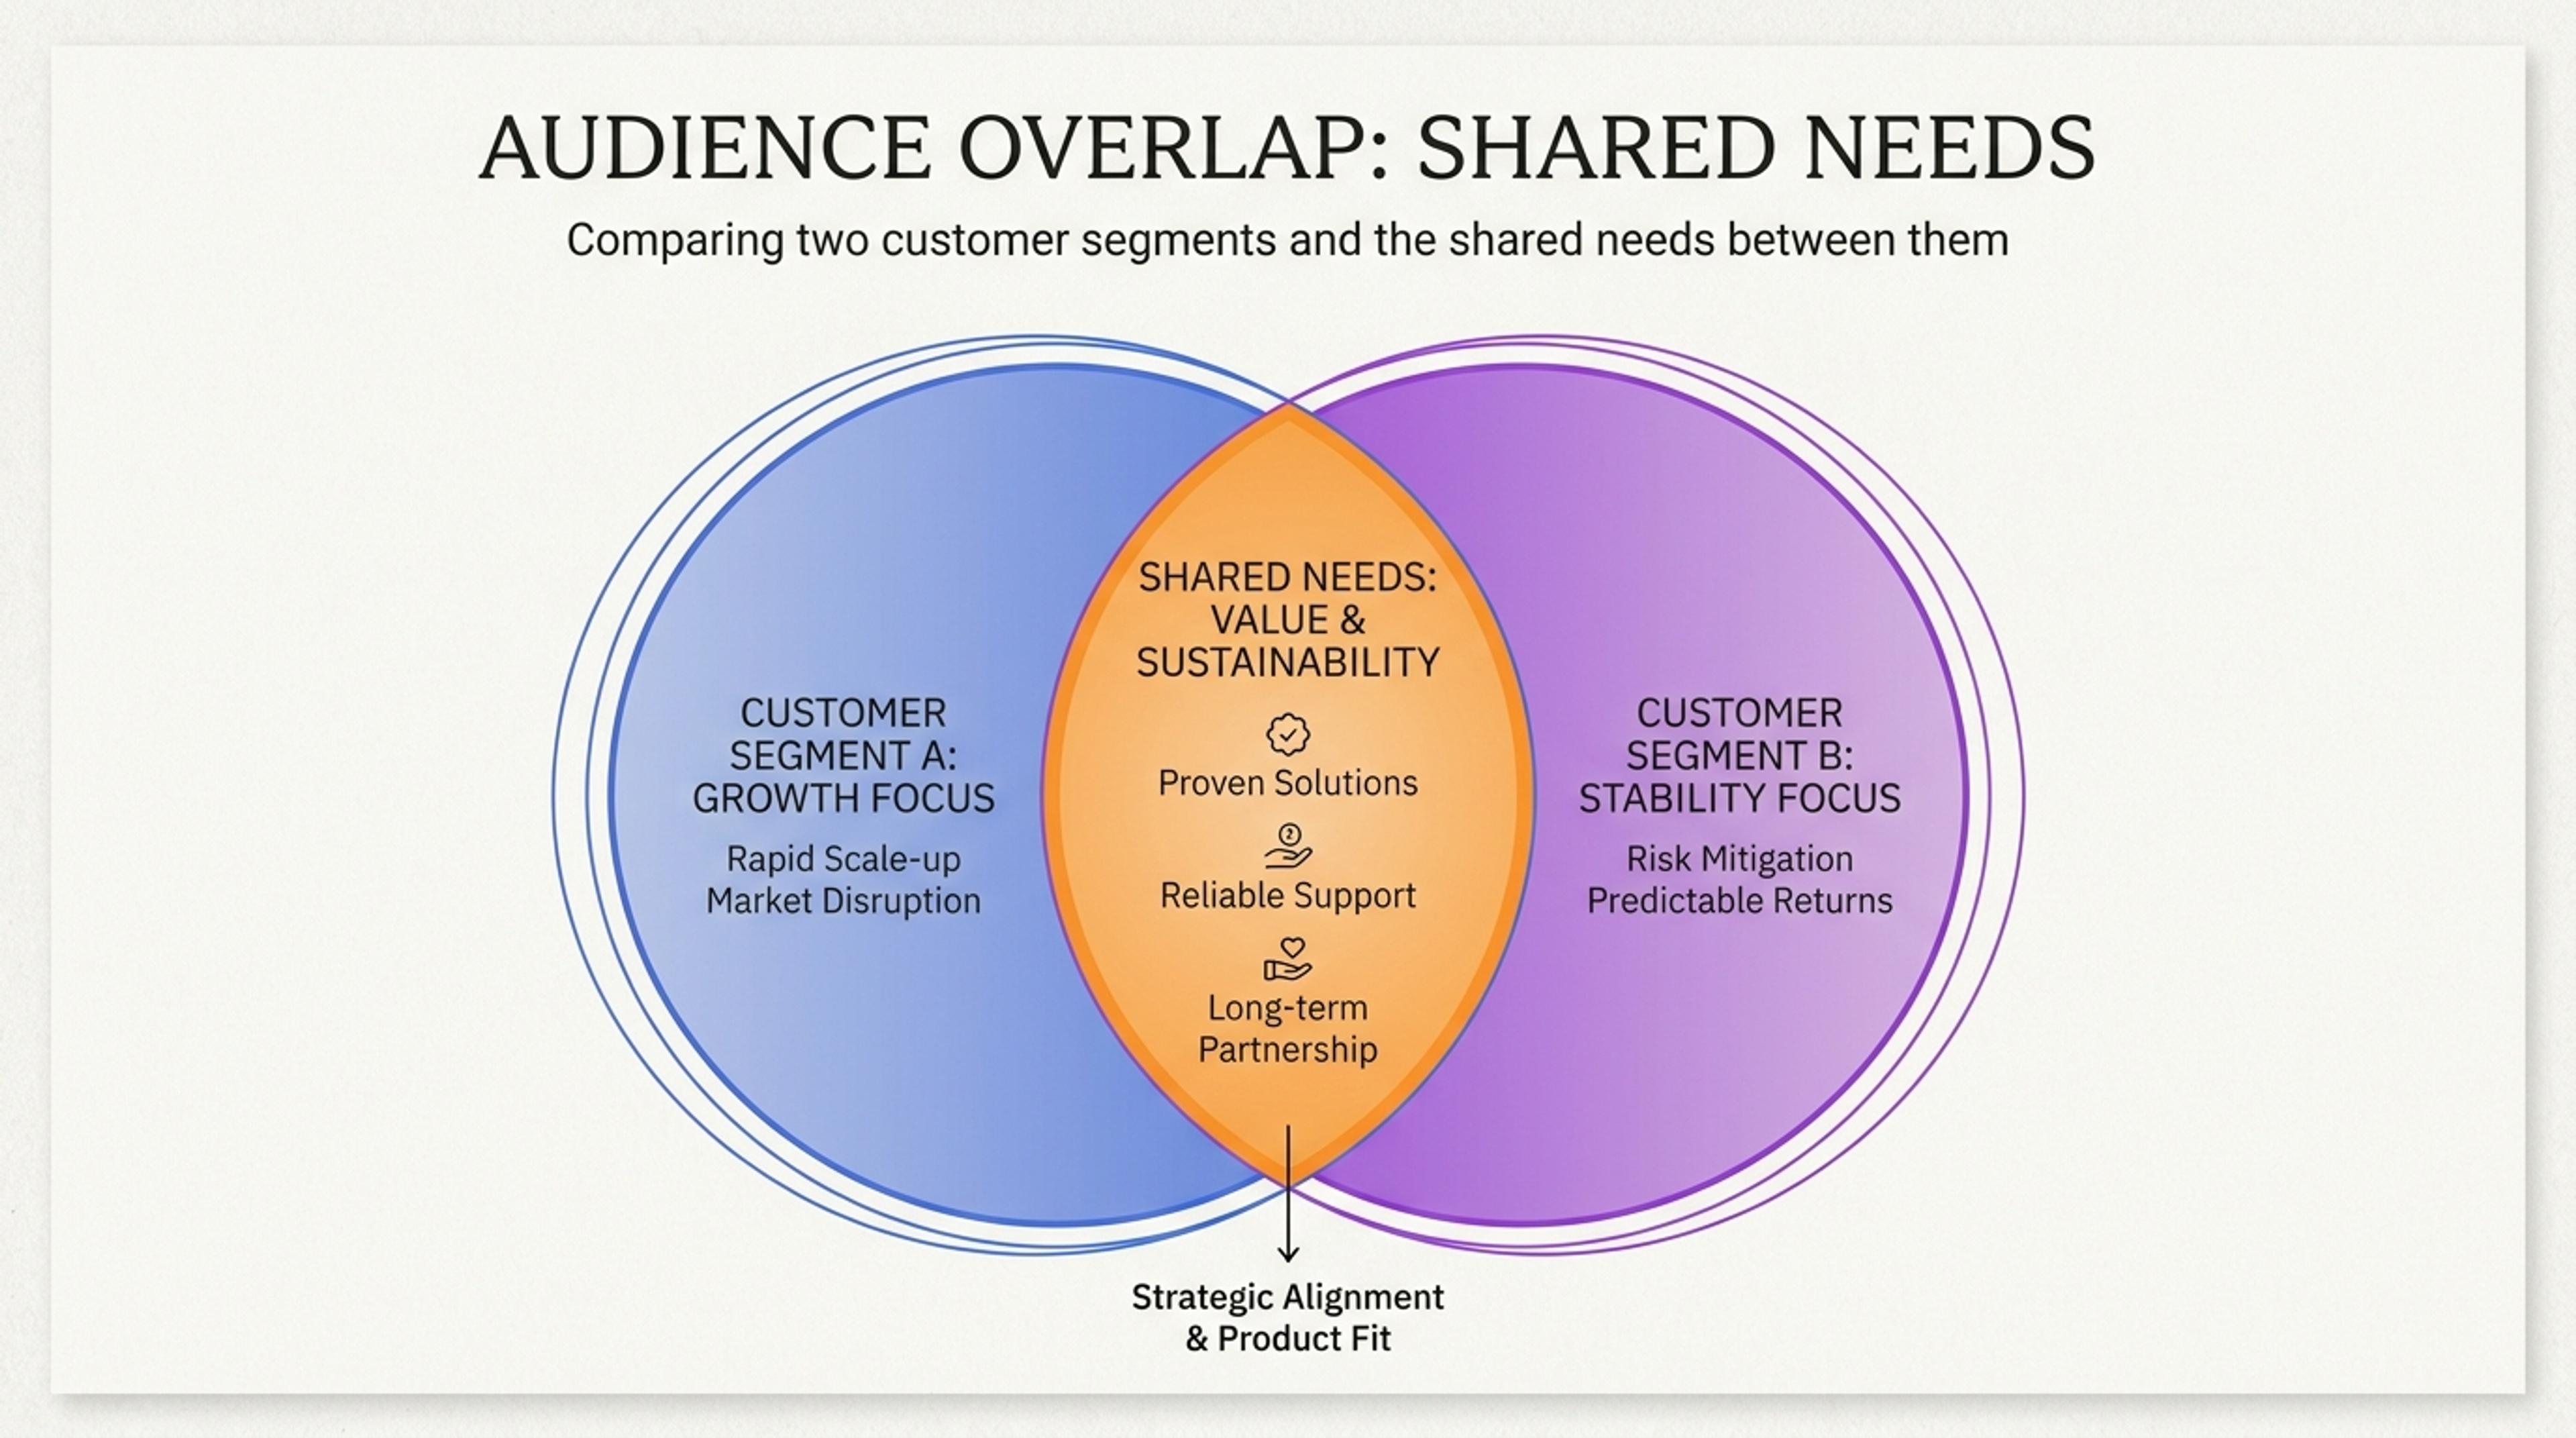
A Venn slide comparing two customer segments and the shared needs between them.
Use it when overlap is the main idea. If you only need a side-by-side list of differences, a comparison table may be clearer.
Yes. Three-circle Venn diagrams can work, but the labels need to stay short so the overlap remains readable.
The center should contain what the compared ideas genuinely share, or the strategic sweet spot created by the overlap.
Yes. Venn diagrams are useful for showing fit between customer needs, business goals, technical capabilities, or market opportunities.
Yes. You should revise each label so the diagram reflects your exact comparison rather than generic wording.
Use these formats when overlap needs to become a mind map, strategy framework, timeline, or broader infographic.
Turn topics, notes, documents, and links into editable visuals for slide decks, lessons, reports, and planning conversations.
Turn events, milestones, roadmap phases, project plans, and historical sequences into a slide-ready timeline.
Organize scattered notes, research themes, brainstorms, and lesson topics into a clear editable mind map.
Organize strengths, weaknesses, opportunities, and threats into a clear strategic planning slide.
Visualize conversion stages, selection processes, sales pipelines, recruiting steps, and drop-off points in a funnel chart.
Describe the ideas, audiences, or products you want to compare and turn them into an editable Venn diagram.