


Explain scientific structure clearly
Turn lesson notes, research summaries, or biology concepts into a double helix visual that is easier to present.
Explain DNA concepts, paired research tracks, or two connected strands of work with an editable double helix visual.
Drag & drop your file here or
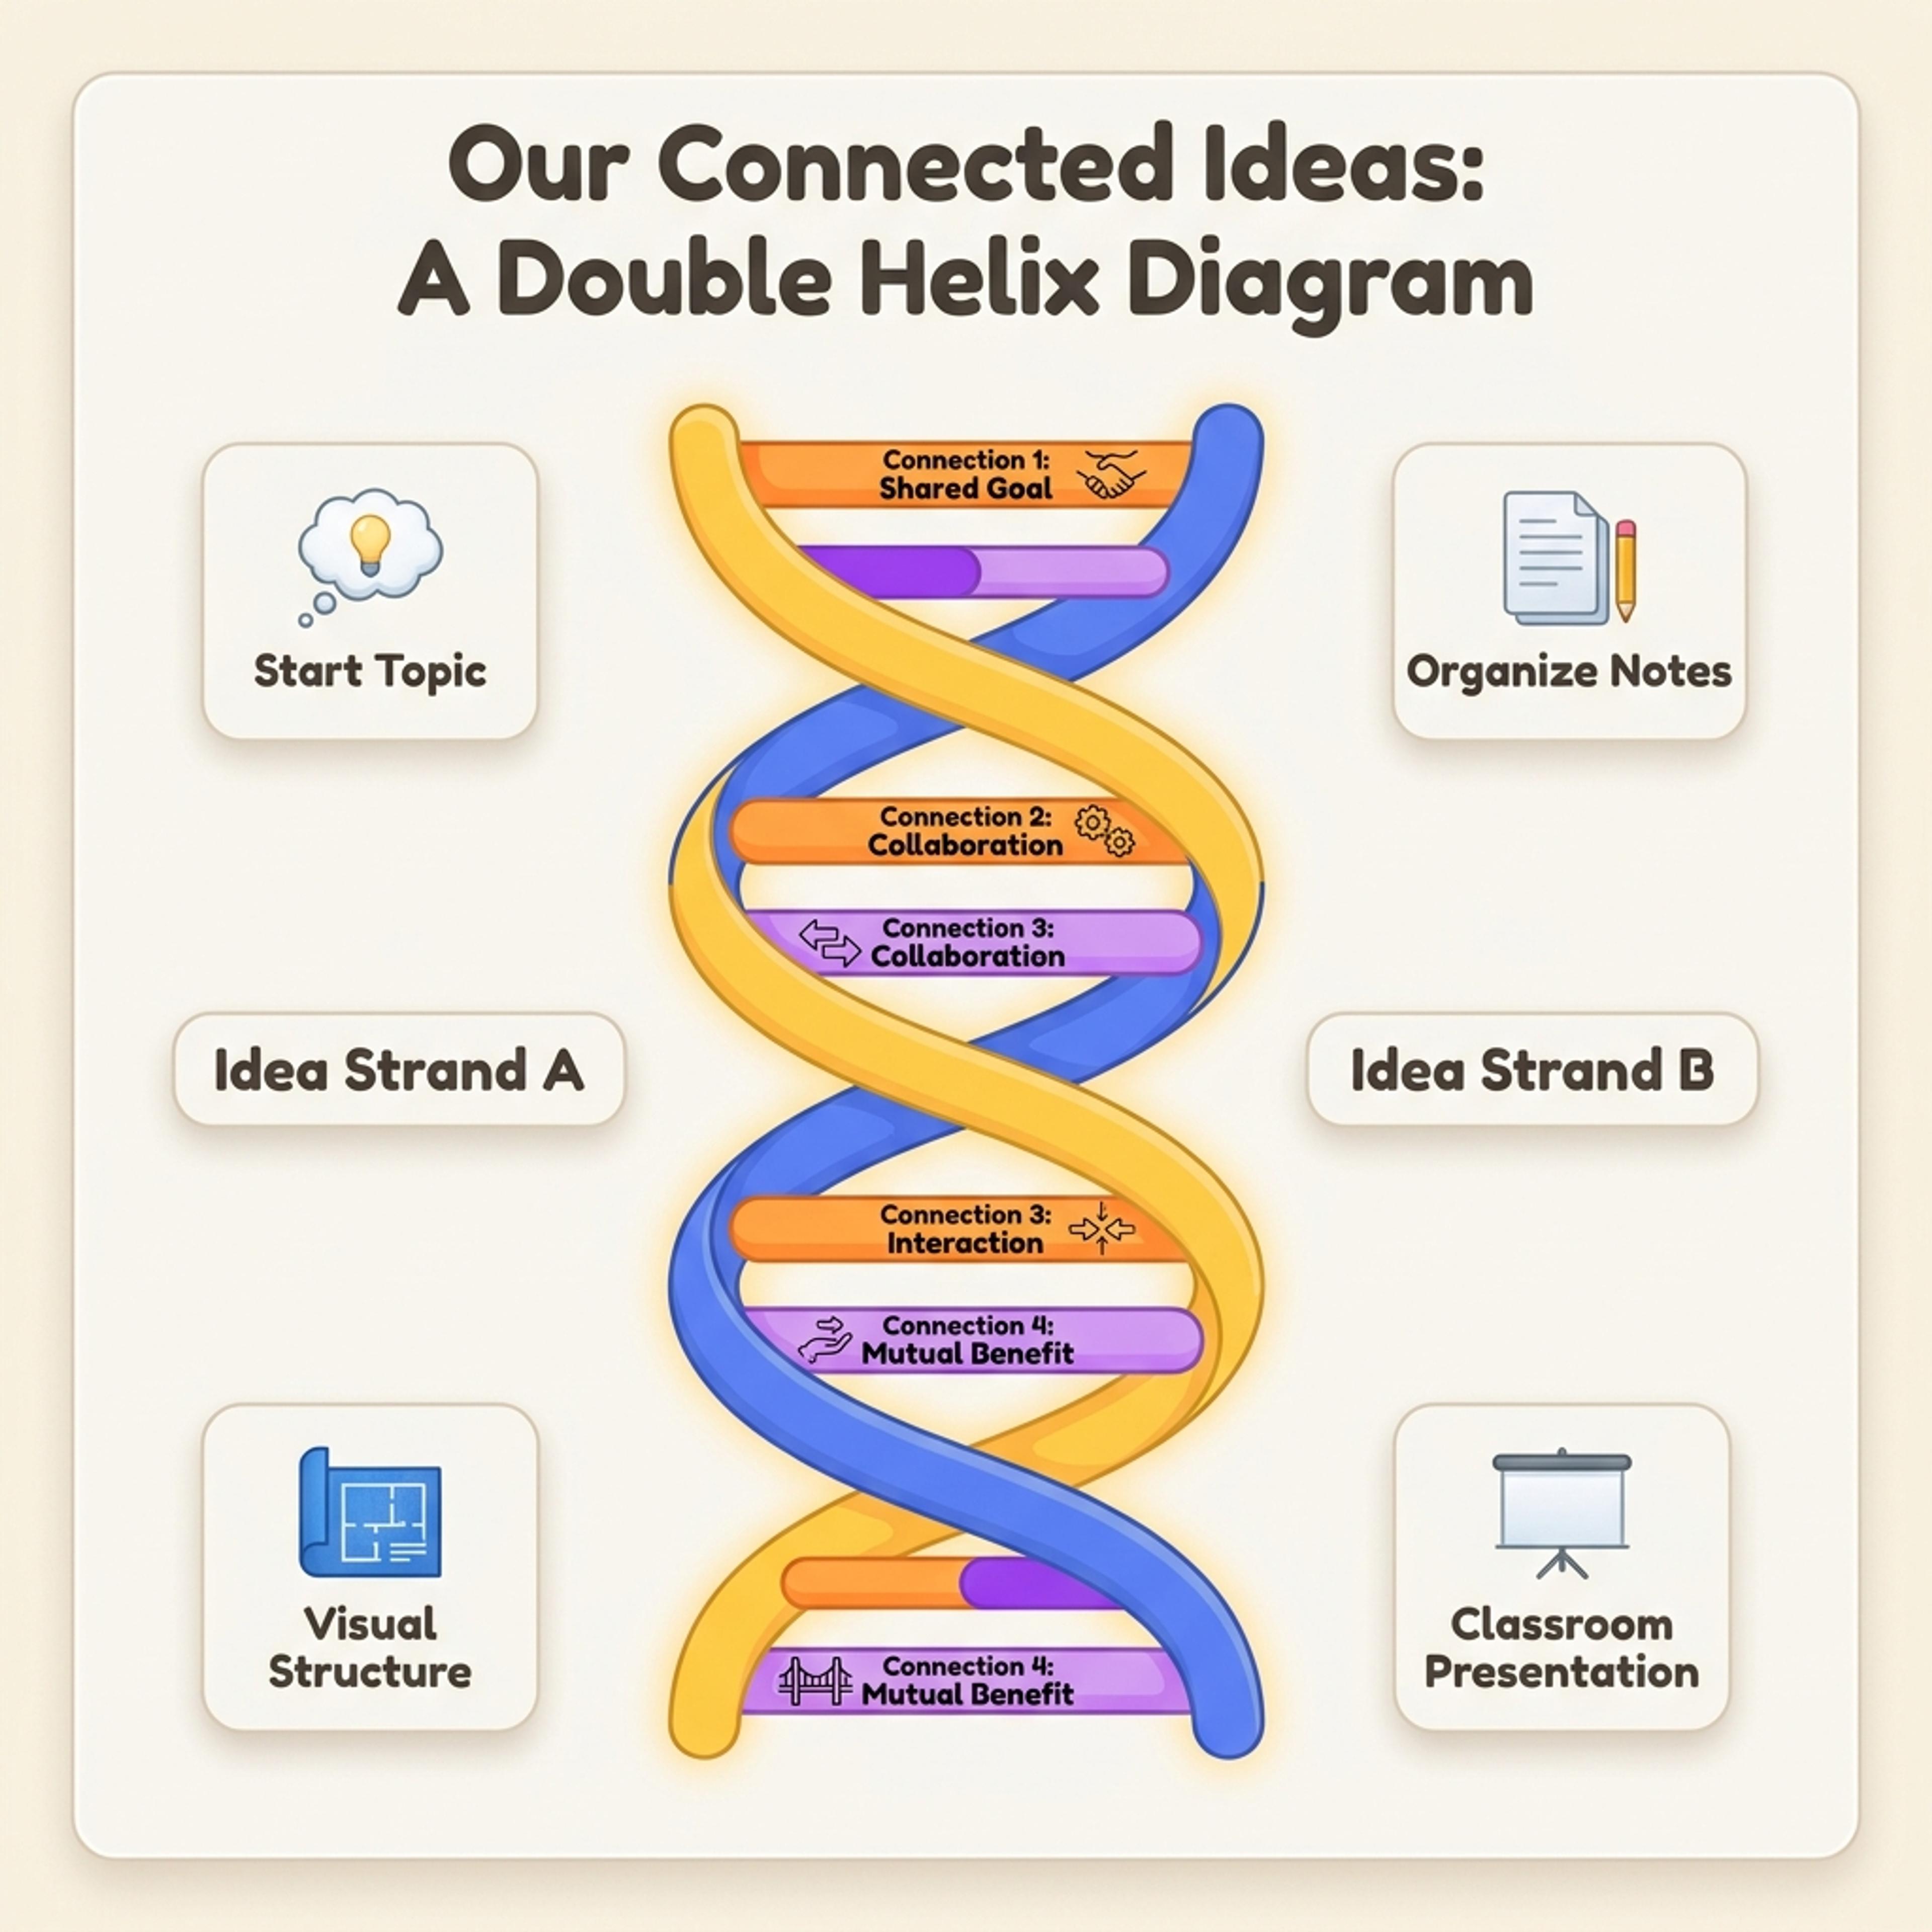
A double helix diagram can explain DNA structure, paired scientific ideas, or two workstreams that develop together and depend on each other.
Use this format when two connected strands need to be shown as related, parallel, and mutually reinforcing.
Turn lesson notes, research summaries, or biology concepts into a double helix visual that is easier to present.
Use the layout for paired research tracks, technology and operations, evidence and impact, or other linked workstreams.
Refine labels, simplify scientific language, or adapt the metaphor for a business or academic presentation.
Provide the two strands and their connection points, then refine the language for your audience.
Describe the scientific topic, paired workstreams, or two related ideas you want the helix to show.
Add supporting notes so AI can name the strands, connection points, and explanation in the right level of detail.
Check the labels for accuracy, simplify anything too technical, and make sure the metaphor helps rather than distracts.
Use double helix diagrams when two related tracks need to evolve together inside one slide story.
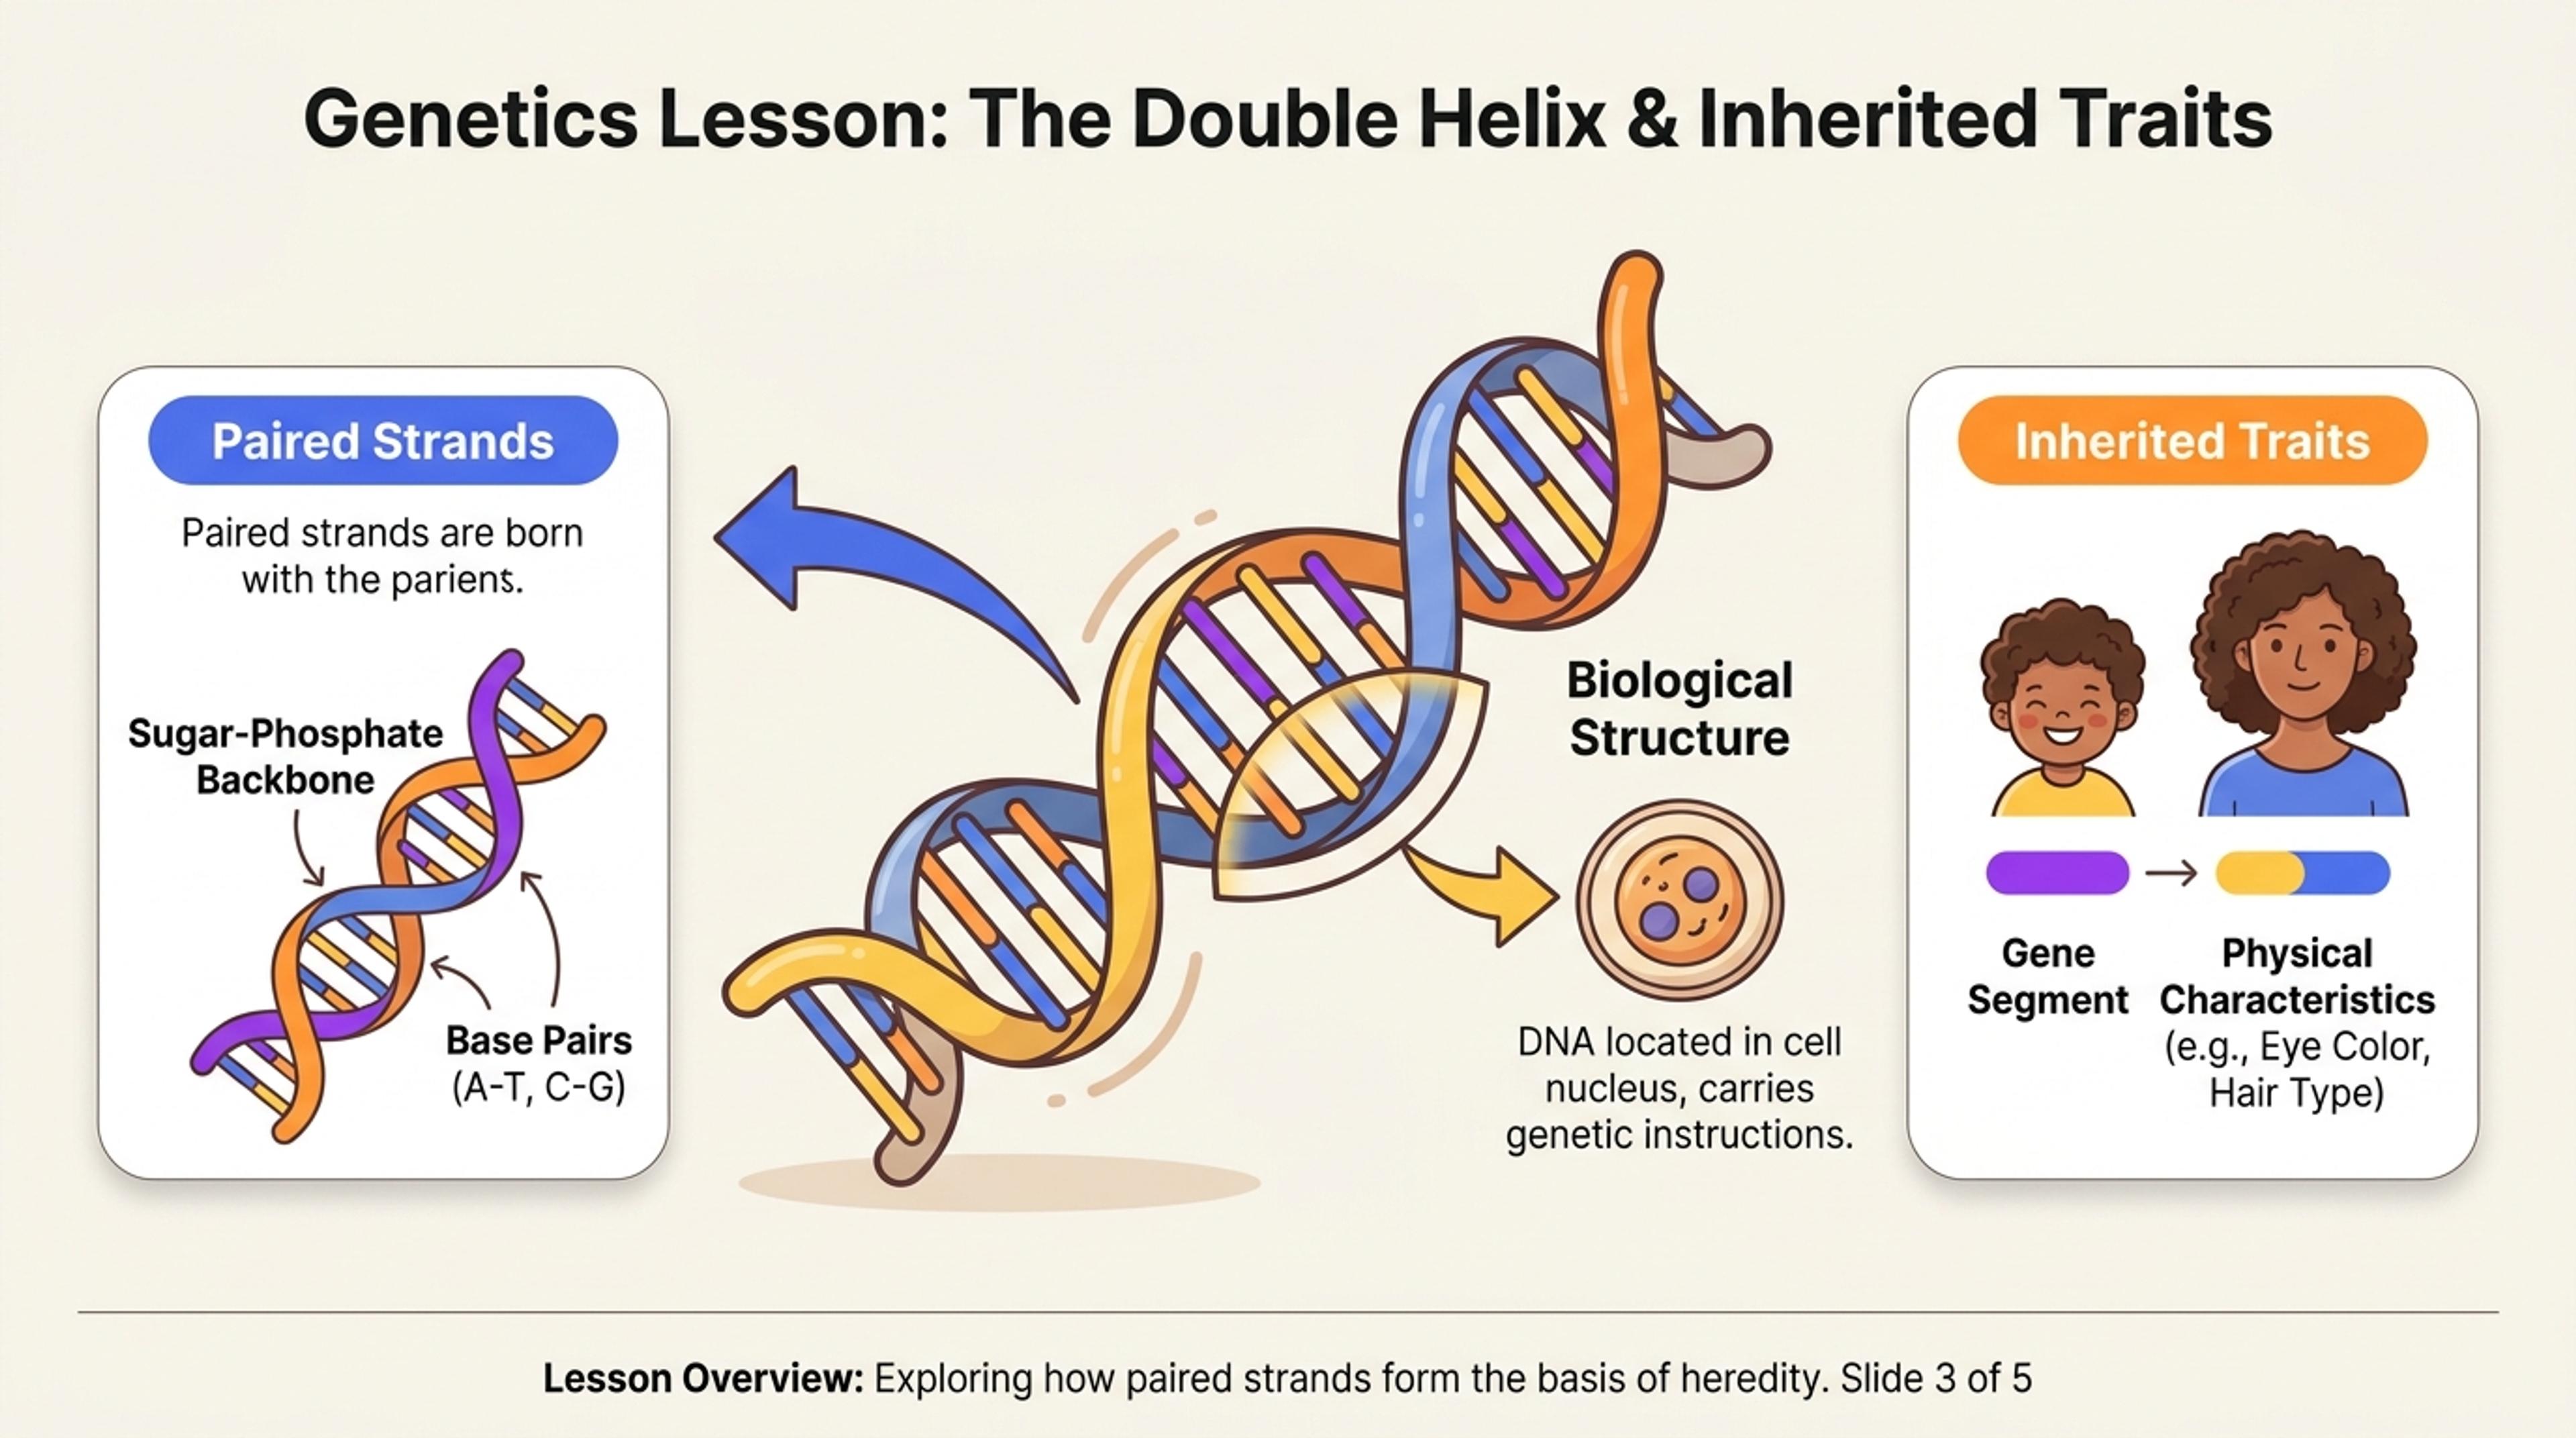
A clean science slide that explains paired strands, inherited traits, and biological structure without textbook clutter.
No. It works well for DNA and genetics, but it can also represent two connected strands of work, research, or strategy.
Yes. Provide the concept and audience level so the generated labels are appropriate for introductory, advanced, or review material.
Yes, as long as the two strands are genuinely connected. It can work for paired capabilities, parallel research paths, or linked transformation efforts.
You should review it carefully. AI can draft the layout and labels, but scientific claims and terminology still need human checking.
Yes. You can revise labels, shorten explanations, and adapt the final diagram for your presentation style.
Use these formats for science explanations, paired ideas, concept maps, or structured comparisons.
Turn topics, notes, documents, and links into editable visuals for slide decks, lessons, reports, and planning conversations.
Map thinking patterns, learning concepts, mental models, and decision factors in a brain-shaped presentation visual.
Organize scattered notes, research themes, brainstorms, and lesson topics into a clear editable mind map.
Turn events, milestones, roadmap phases, project plans, and historical sequences into a slide-ready timeline.
Compare overlap, differences, shared traits, and strategic fit with an editable Venn diagram for slides.
Describe the two strands, scientific topic, or paired system and turn it into an editable presentation visual.