

How to Make a Flowchart in PowerPoint (With Examples)
Make a flowchart in PowerPoint from scratch, starting with four boxes and adding a decision when the process can take more than one path.
Make a flowchart in PowerPoint from scratch, starting with four boxes and adding a decision when the process can take more than one path.
A flowchart turns a process into a picture. Put each step in a box and draw arrows to show what comes next. If a decision changes the next step, give each answer its own arrow.
In PowerPoint, use SmartArt when the steps follow one path. Use individual shapes and connectors when you need to show a decision, a branch, or a step that repeats.
Demonstration example: Start → Step 1 → Step 2 → End
When you adapt the example, replace Step 1 and Step 2 with short action labels. Give each box one job so the sequence stays easy to follow.
Demonstration example: Add a decision after Step 2. If the step is complete, the flowchart ends. If it’s incomplete, the arrow goes back to Step 2.
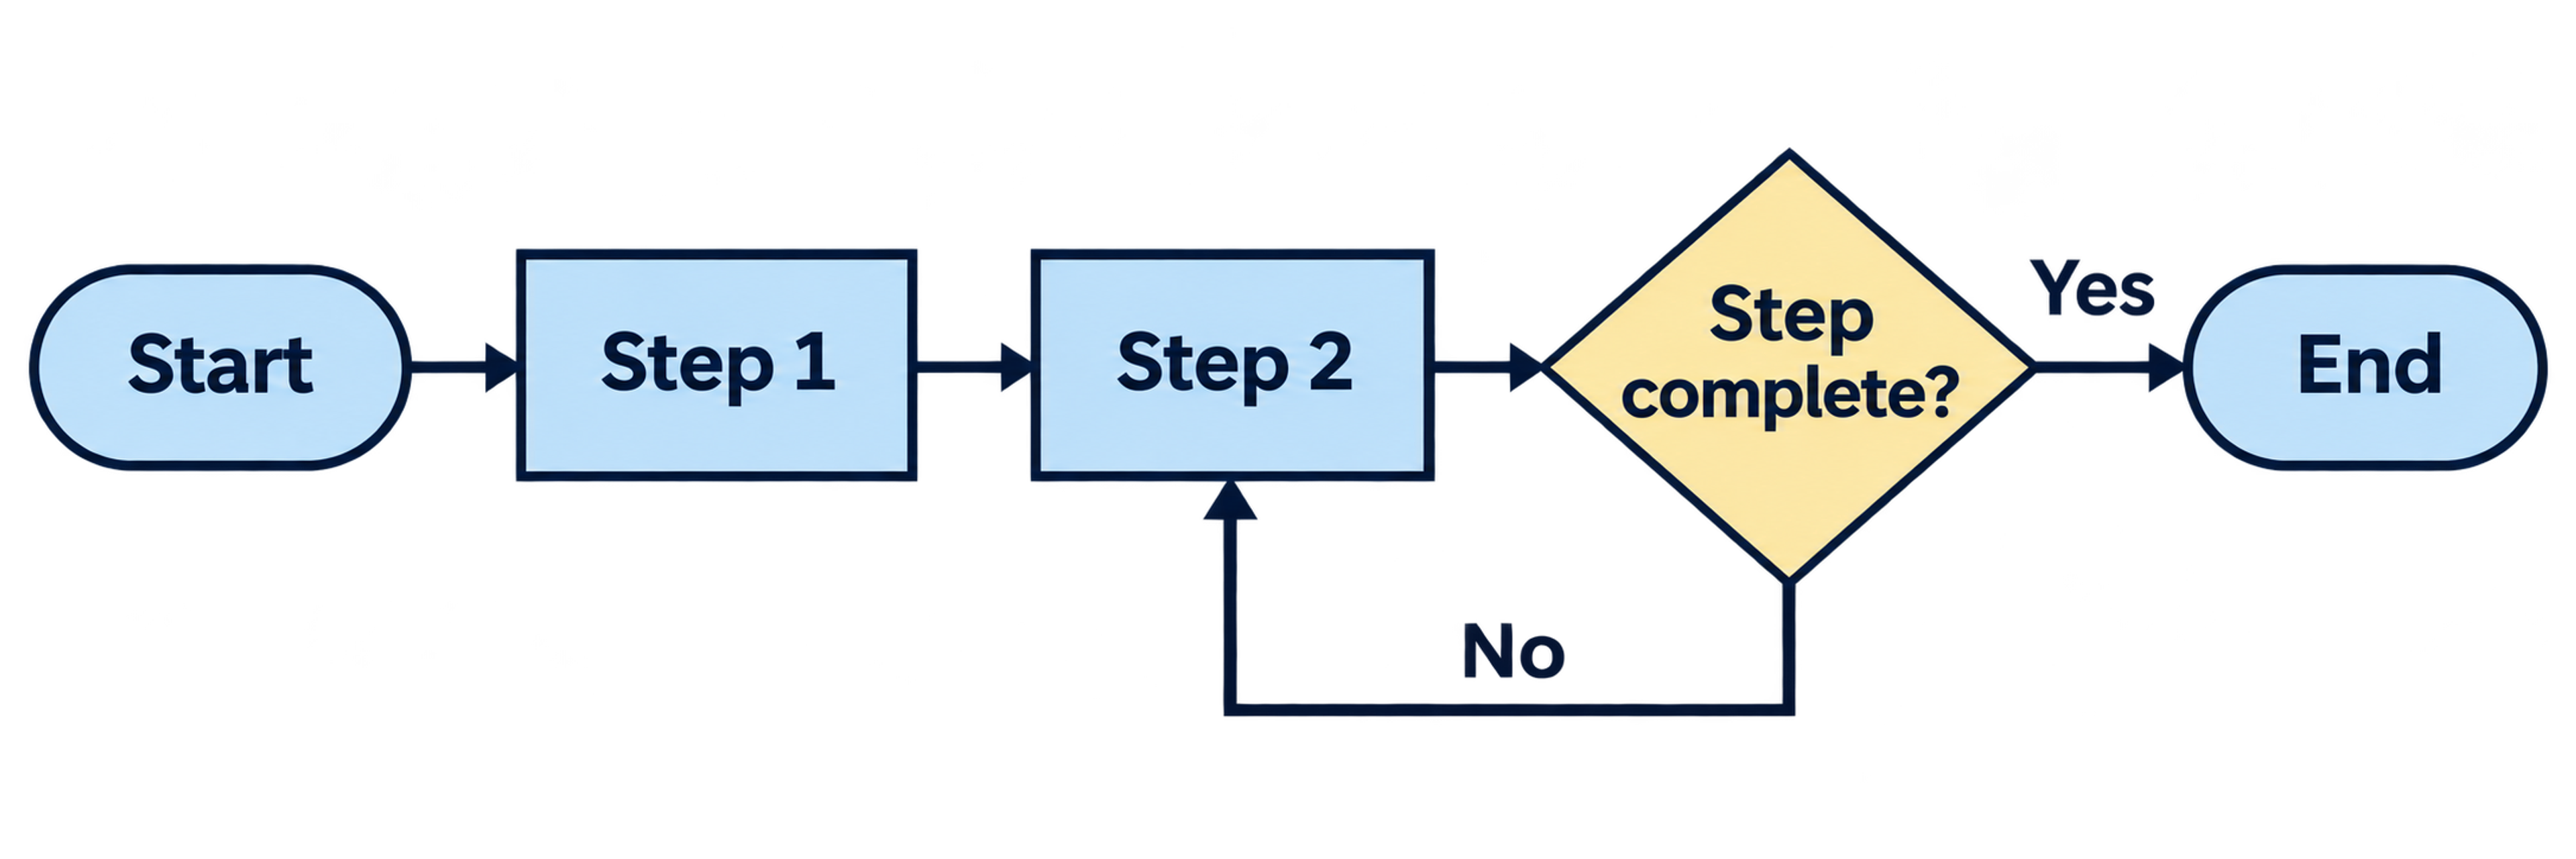
Start → Step 1 → Step 2 → Step complete?
| Symbol | Meaning | Example label |
|---|---|---|
| Oval or rounded rectangle | Start or end of the process | Start, End |
| Rectangle | An action or step | Step 1, Step 2 |
| Diamond | A decision that changes the path | Step complete? |
| Arrow connector | Direction of the flow | Yes or No on the arrows leaving the diamond |
Keep one reading direction for the main path, and use the space above or below it for branches. Label each branch beside the arrow that leaves the diamond. That way, readers can follow the paths even when the slide is printed in black and white.
If several people or teams own different steps, use a swimlane flowchart. Add a row for each owner and put each step in the appropriate row. Arrows crossing from one row to another show where the work changes hands.
If you have the steps ready, type them into SlidesPilot’s AI Infographic Generator. Describe the order and how the boxes should connect, and SlidesPilot will draft a visual for your slide.
Example prompt to copy
Create a flowchart for one PowerPoint slide. Put Start, Step 1, Step 2, and End in four boxes from left to right. Connect each box to the next with an arrow. Use large, easy-to-read labels.
Copy the example or replace the sample labels with your own steps.
Generate a FlowchartA diagram shows relationships between things. A flowchart is a type of diagram that shows the order of steps and where the process can change direction.
Choose a connector from Insert → Shapes → Lines and attach both ends to connection points. If an arrow stays behind when you move a box, drag its loose end back onto a connection point.
Duplicate the slide and replace the labels. If a new decision sends the process along a different path, move the connector and update its label together.
Start with a list of steps, a document, or a link. SlidesPilot can turn your material into a visual draft for your presentation.