

How to Present Research Findings Without Overloading Your Slides
A practical guide to turning dense research results into clear slides that help your audience understand the finding, evidence, and implication.
A practical guide to turning dense research results into clear slides that help your audience understand the finding, evidence, and implication.
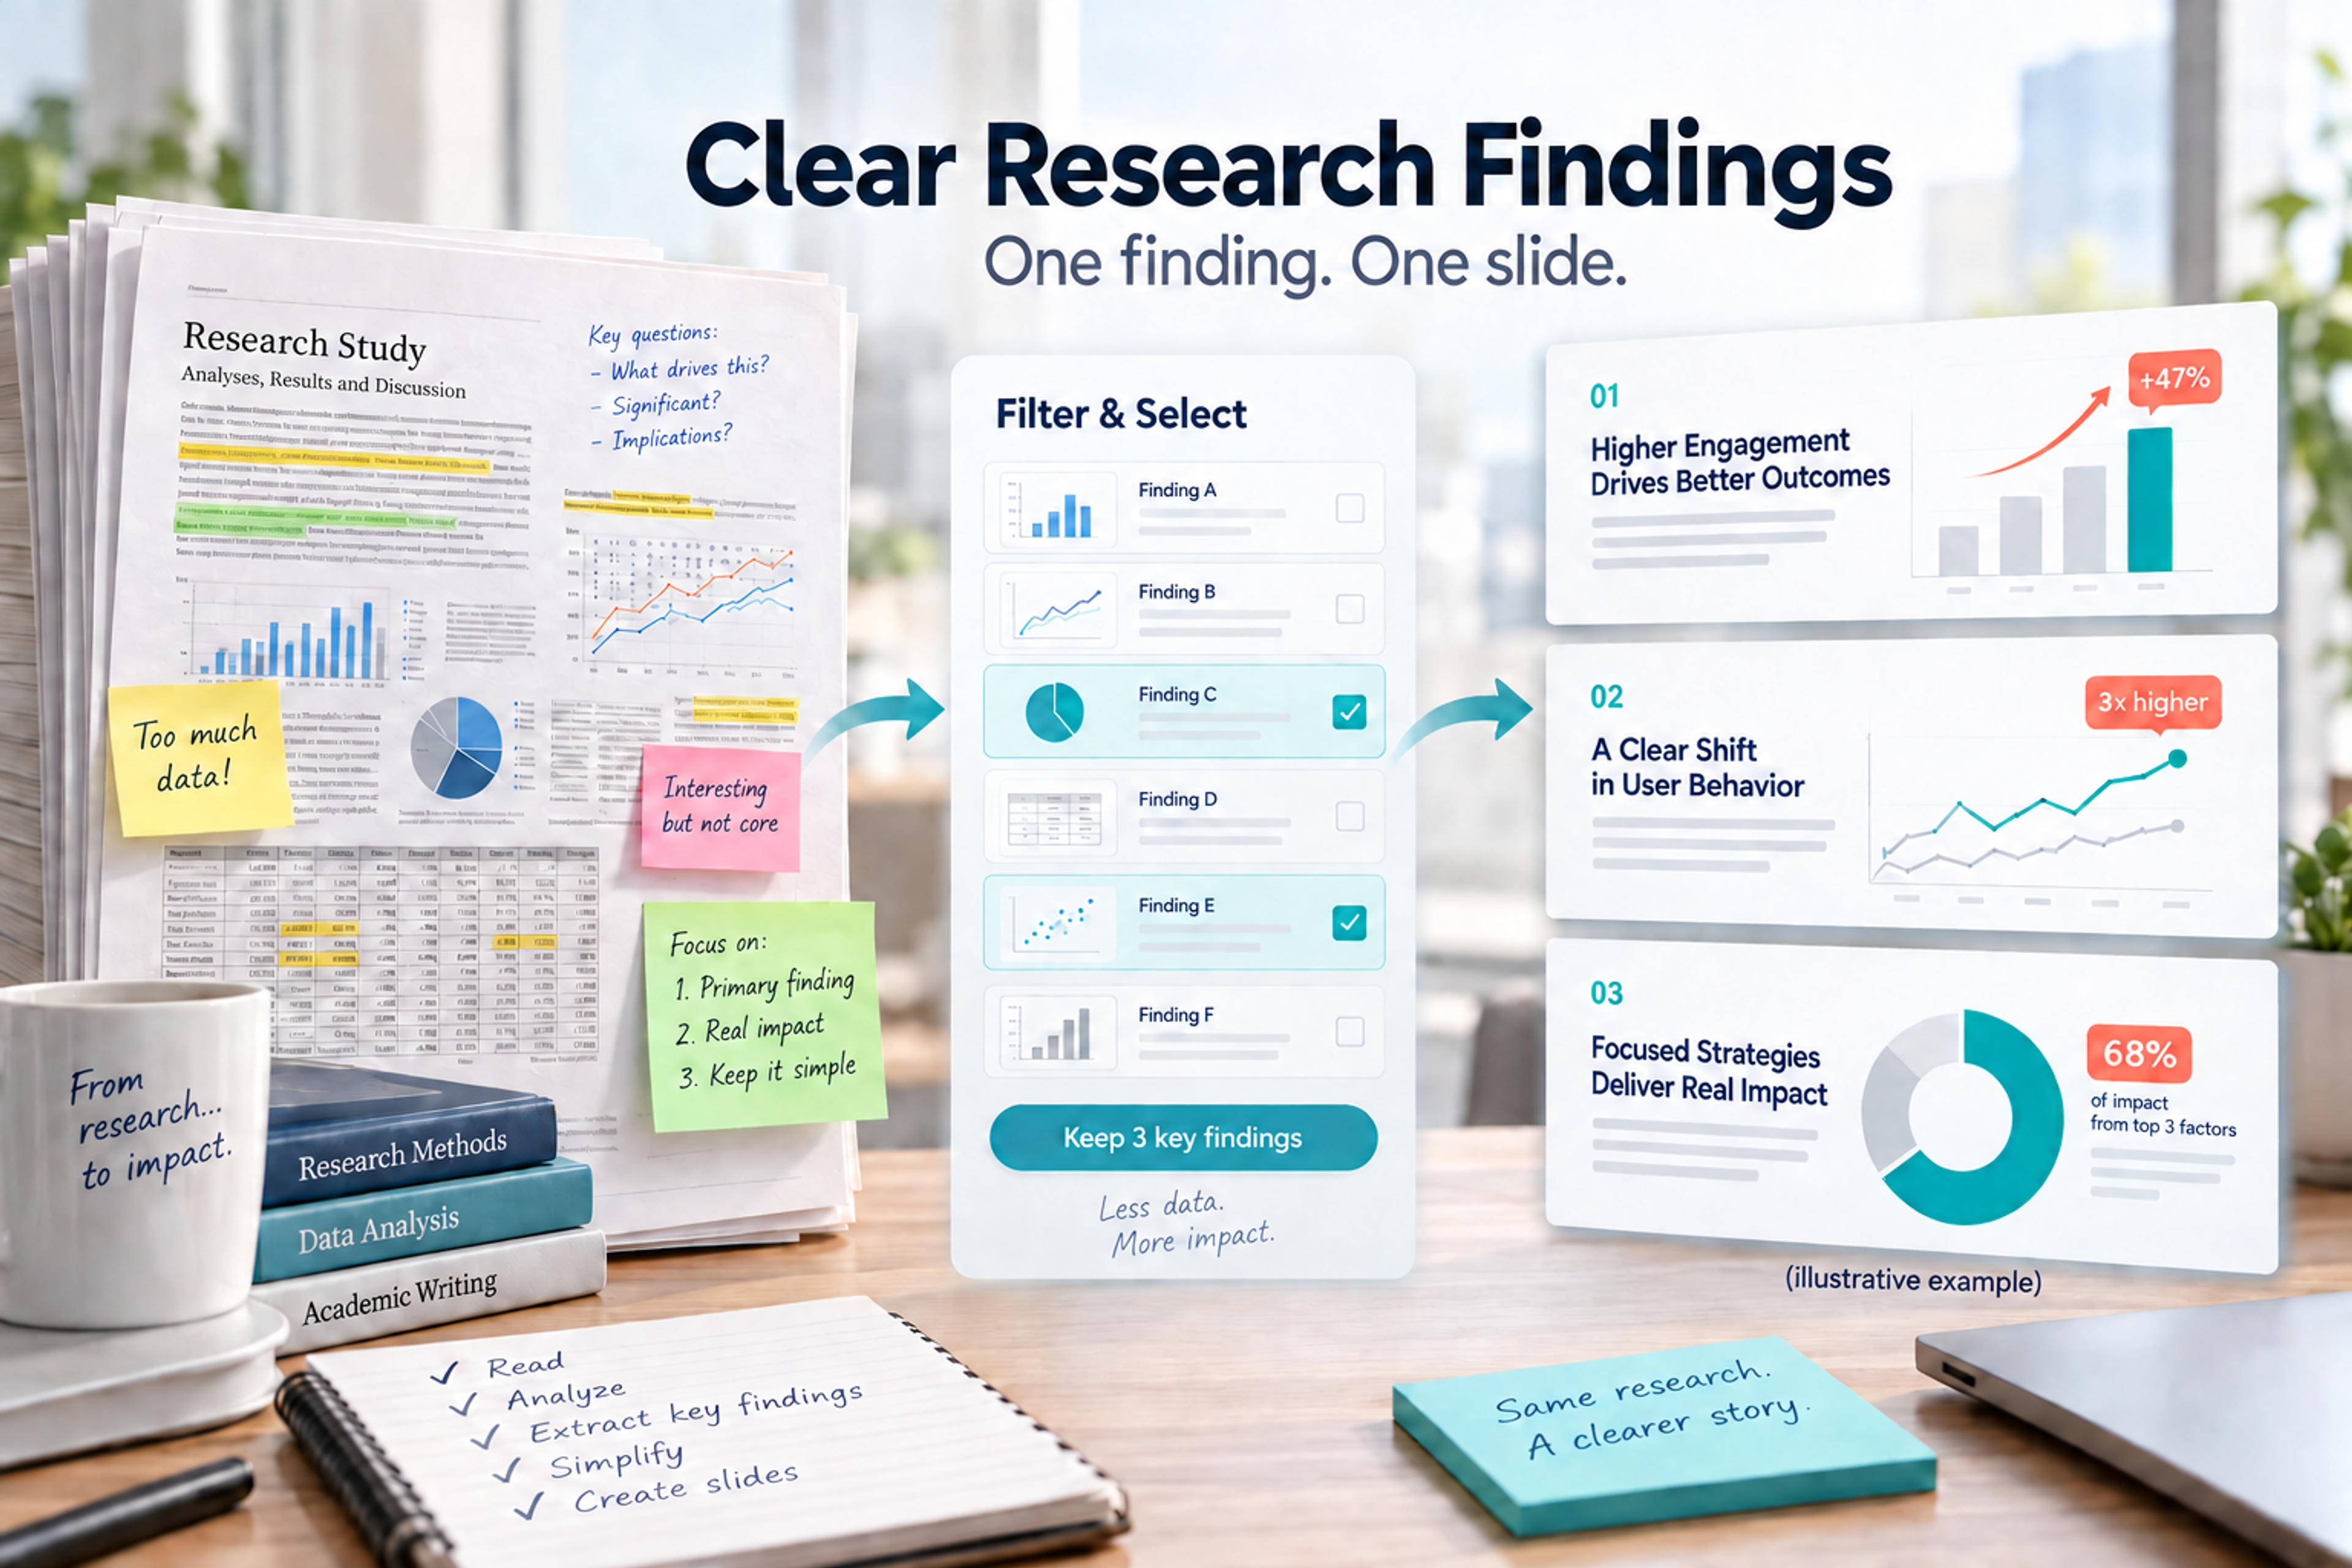
To present research findings without overloading your slides, treat each slide as a decision about attention. Put one finding at the center, show only the evidence needed to support it, and move detail into your spoken explanation, appendix, or handout.
That sounds simple, but research presentations often become crowded because the presenter is trying to prove rigor, preserve nuance, and respect the work behind every result. A good findings deck does not hide complexity. It sequences complexity so the audience can understand the main result before they inspect the details.
Before choosing charts or copying tables, write the answer your audience should take away from the results section. This is not the title of your paper and not a restatement of the research question. It is the practical meaning of what you found.
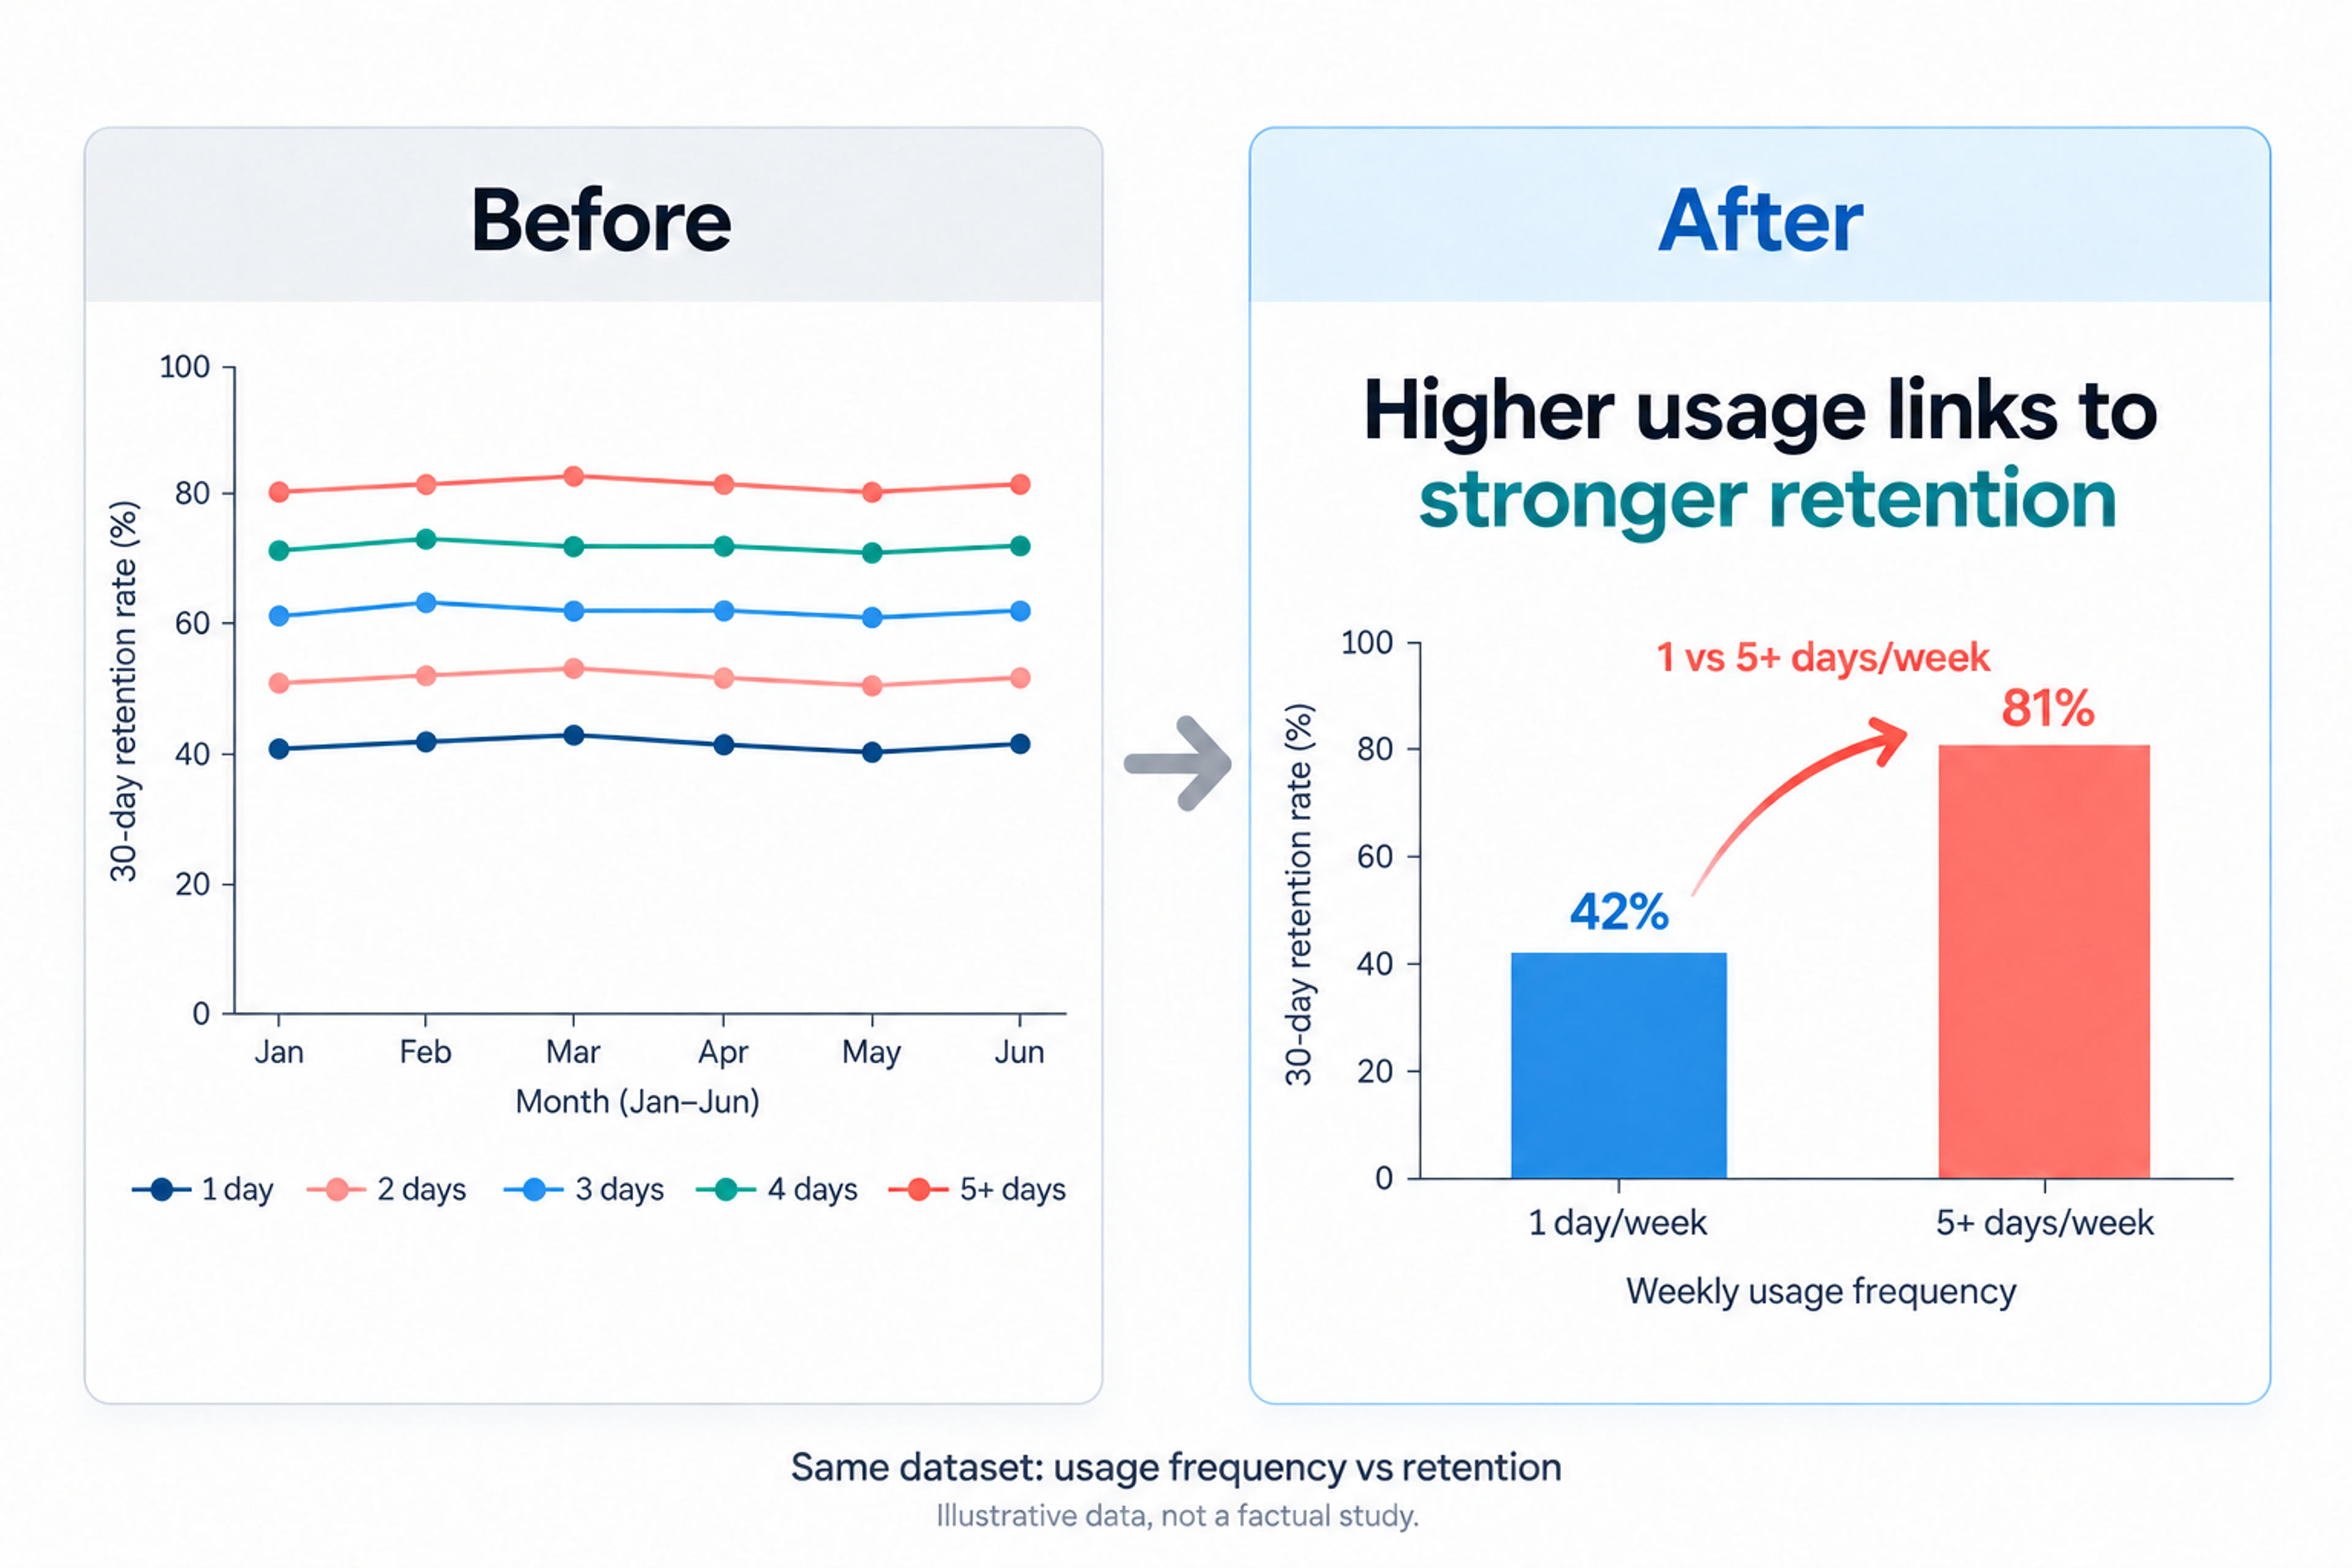
For example, instead of building a slide around "Regression Results," build it around "Usage frequency predicted retention more strongly than onboarding completion." The second version tells the audience what to look for and why the evidence matters.
Use this simple test for every finding slide: if someone saw only the slide title and the visual, could they describe the finding in one sentence? If not, the slide is probably carrying too many messages.
Most overloaded slides come from mixing three different jobs on one canvas: announcing the finding, proving the finding, and explaining every methodological qualification. Those jobs matter, but they do not need the same visual weight.
A cleaner findings slide usually has three layers:
Keep the message and evidence visible. Keep context brief. If a method note, sensitivity check, or secondary result is useful but not essential to the audience's first understanding, place it in speaker notes, a backup slide, or a later deep-dive section.
A strong research findings section rarely includes every result. It includes the results that move the argument forward. When you are deciding what to include, ask what role each finding plays in the story.
| Finding type | Use it when | Slide goal |
|---|---|---|
| Main result | It answers the research question directly | Establish the central claim |
| Contrast | Two groups, cases, periods, or conditions differ meaningfully | Help the audience see what changed |
| Pattern | Several results point in the same direction | Build confidence without listing everything |
| Exception | A result complicates the main story | Preserve nuance without derailing the flow |
| Implication | The result changes what someone should do next | Connect evidence to action |
This filter helps you avoid the common trap of presenting findings in the order they appeared in your analysis. Your audience does not need your entire path through the data. They need the shortest credible path from question to insight.
Upload your paper and let SlidesPilot organize the argument, findings, and supporting evidence into editable presentation slides.
Turn My Research Into SlidesCharts overload slides when they show more data than the audience can interpret in the time available. A research paper can ask readers to study a figure for several minutes. A presentation slide usually has seconds to orient the audience before you start explaining.
Start by deciding what the chart must prove. Then remove or reduce anything that does not help prove that point. You can often simplify a chart slide by using a direct title, labeling the important value, muting secondary series, and moving technical detail into a note.
A good chart slide should answer three questions quickly:
For dense statistical outputs, avoid pasting a full model table unless the table itself is the object of discussion. Show the coefficient, comparison, confidence interval, or ranking that supports the finding. If the full table matters, include it as a backup slide and present a simplified view in the main flow.
Labels like "Survey Results," "Theme 2," or "Model Output" force the audience to interpret the slide while also listening to you. Findings slides work better when titles state the conclusion.
Compare these title patterns:
| Weak label | Stronger findings title |
|---|---|
| Interview Themes | Participants described trust as a condition for adoption |
| Experiment Results | The treatment group completed the task with fewer errors |
| Market Analysis | Demand was strongest among teams with recurring reporting needs |
| Literature Review Findings | Prior work agrees on the problem but not the intervention |
Interpretive titles do not oversell the result. They simply make the slide's job clear. If a finding is tentative, write the title with precise language instead of vague language. "Early responses suggest lower friction" is more useful than "Response Data."
Once each slide has one job, arrange the findings so the audience can follow the argument. A reliable sequence is:
This order is especially useful when you are turning a long PDF, journal article, or scientific paper into a presentation. The original document may be organized for reading, citation, and replication. Your presentation needs to be organized for listening, scanning, and discussion.
Research audiences care about how findings were produced. Still, the methods section should not consume the findings section. Place the method details where they help the audience trust and interpret the result.
For a short talk, one methods slide before the findings may be enough. For a thesis defense, technical review, or conference presentation, you may need method detail throughout the deck. Even then, make each method note serve the finding on screen. Instead of listing every data-cleaning step, include the sample, comparison, measure, or procedure the audience needs to understand the result.
A useful rule is to ask, "Would this detail change how the audience interprets the finding?" If yes, include it. If not, move it out of the main slide path.
If your findings live inside a research paper, PDF report, or long technical document, SlidesPilot can help you move from source material to a structured first draft. SlidesPilot turns source material into an editable presentation, identifies key ideas, organizes the slide story, writes presentation-ready content, and applies a professional visual direction.
That first draft is most useful when you bring a clear editorial goal to it. Decide which findings belong in the main story, which evidence should become visuals, and which details should stay in notes or backup slides. Then refine the deck so each slide has one message, one evidence focus, and a clear implication.
Before you present, review your findings slides with this checklist:
The goal is not to make research look simple. The goal is to make the path through the research clear. When your slides guide attention carefully, the audience can see both the strength of the evidence and the meaning of the findings.
Turn a research paper into a clear, editable PowerPoint covering the question, methods, results, limitations, and citations.
Turn reports, papers, and documents into clear, structured, editable PowerPoint presentations with AI.
Paste text, add a YouTube or webpage link, or upload a document to create a beautiful, structured summary connected to the source.
Transform plain PowerPoint presentations into professional designs using AI
Turn your paper or report into an editable deck that organizes findings, evidence, and implications for your audience.


