

Lead with financial performance
Surface revenue, margin, cash flow, growth, and the KPIs that define the reporting period.
Transform dense financial data into clear PowerPoint presentations
Drag & drop your file here or
Turn financial tables and commentary into slides that explain variance, drivers, and decisions.
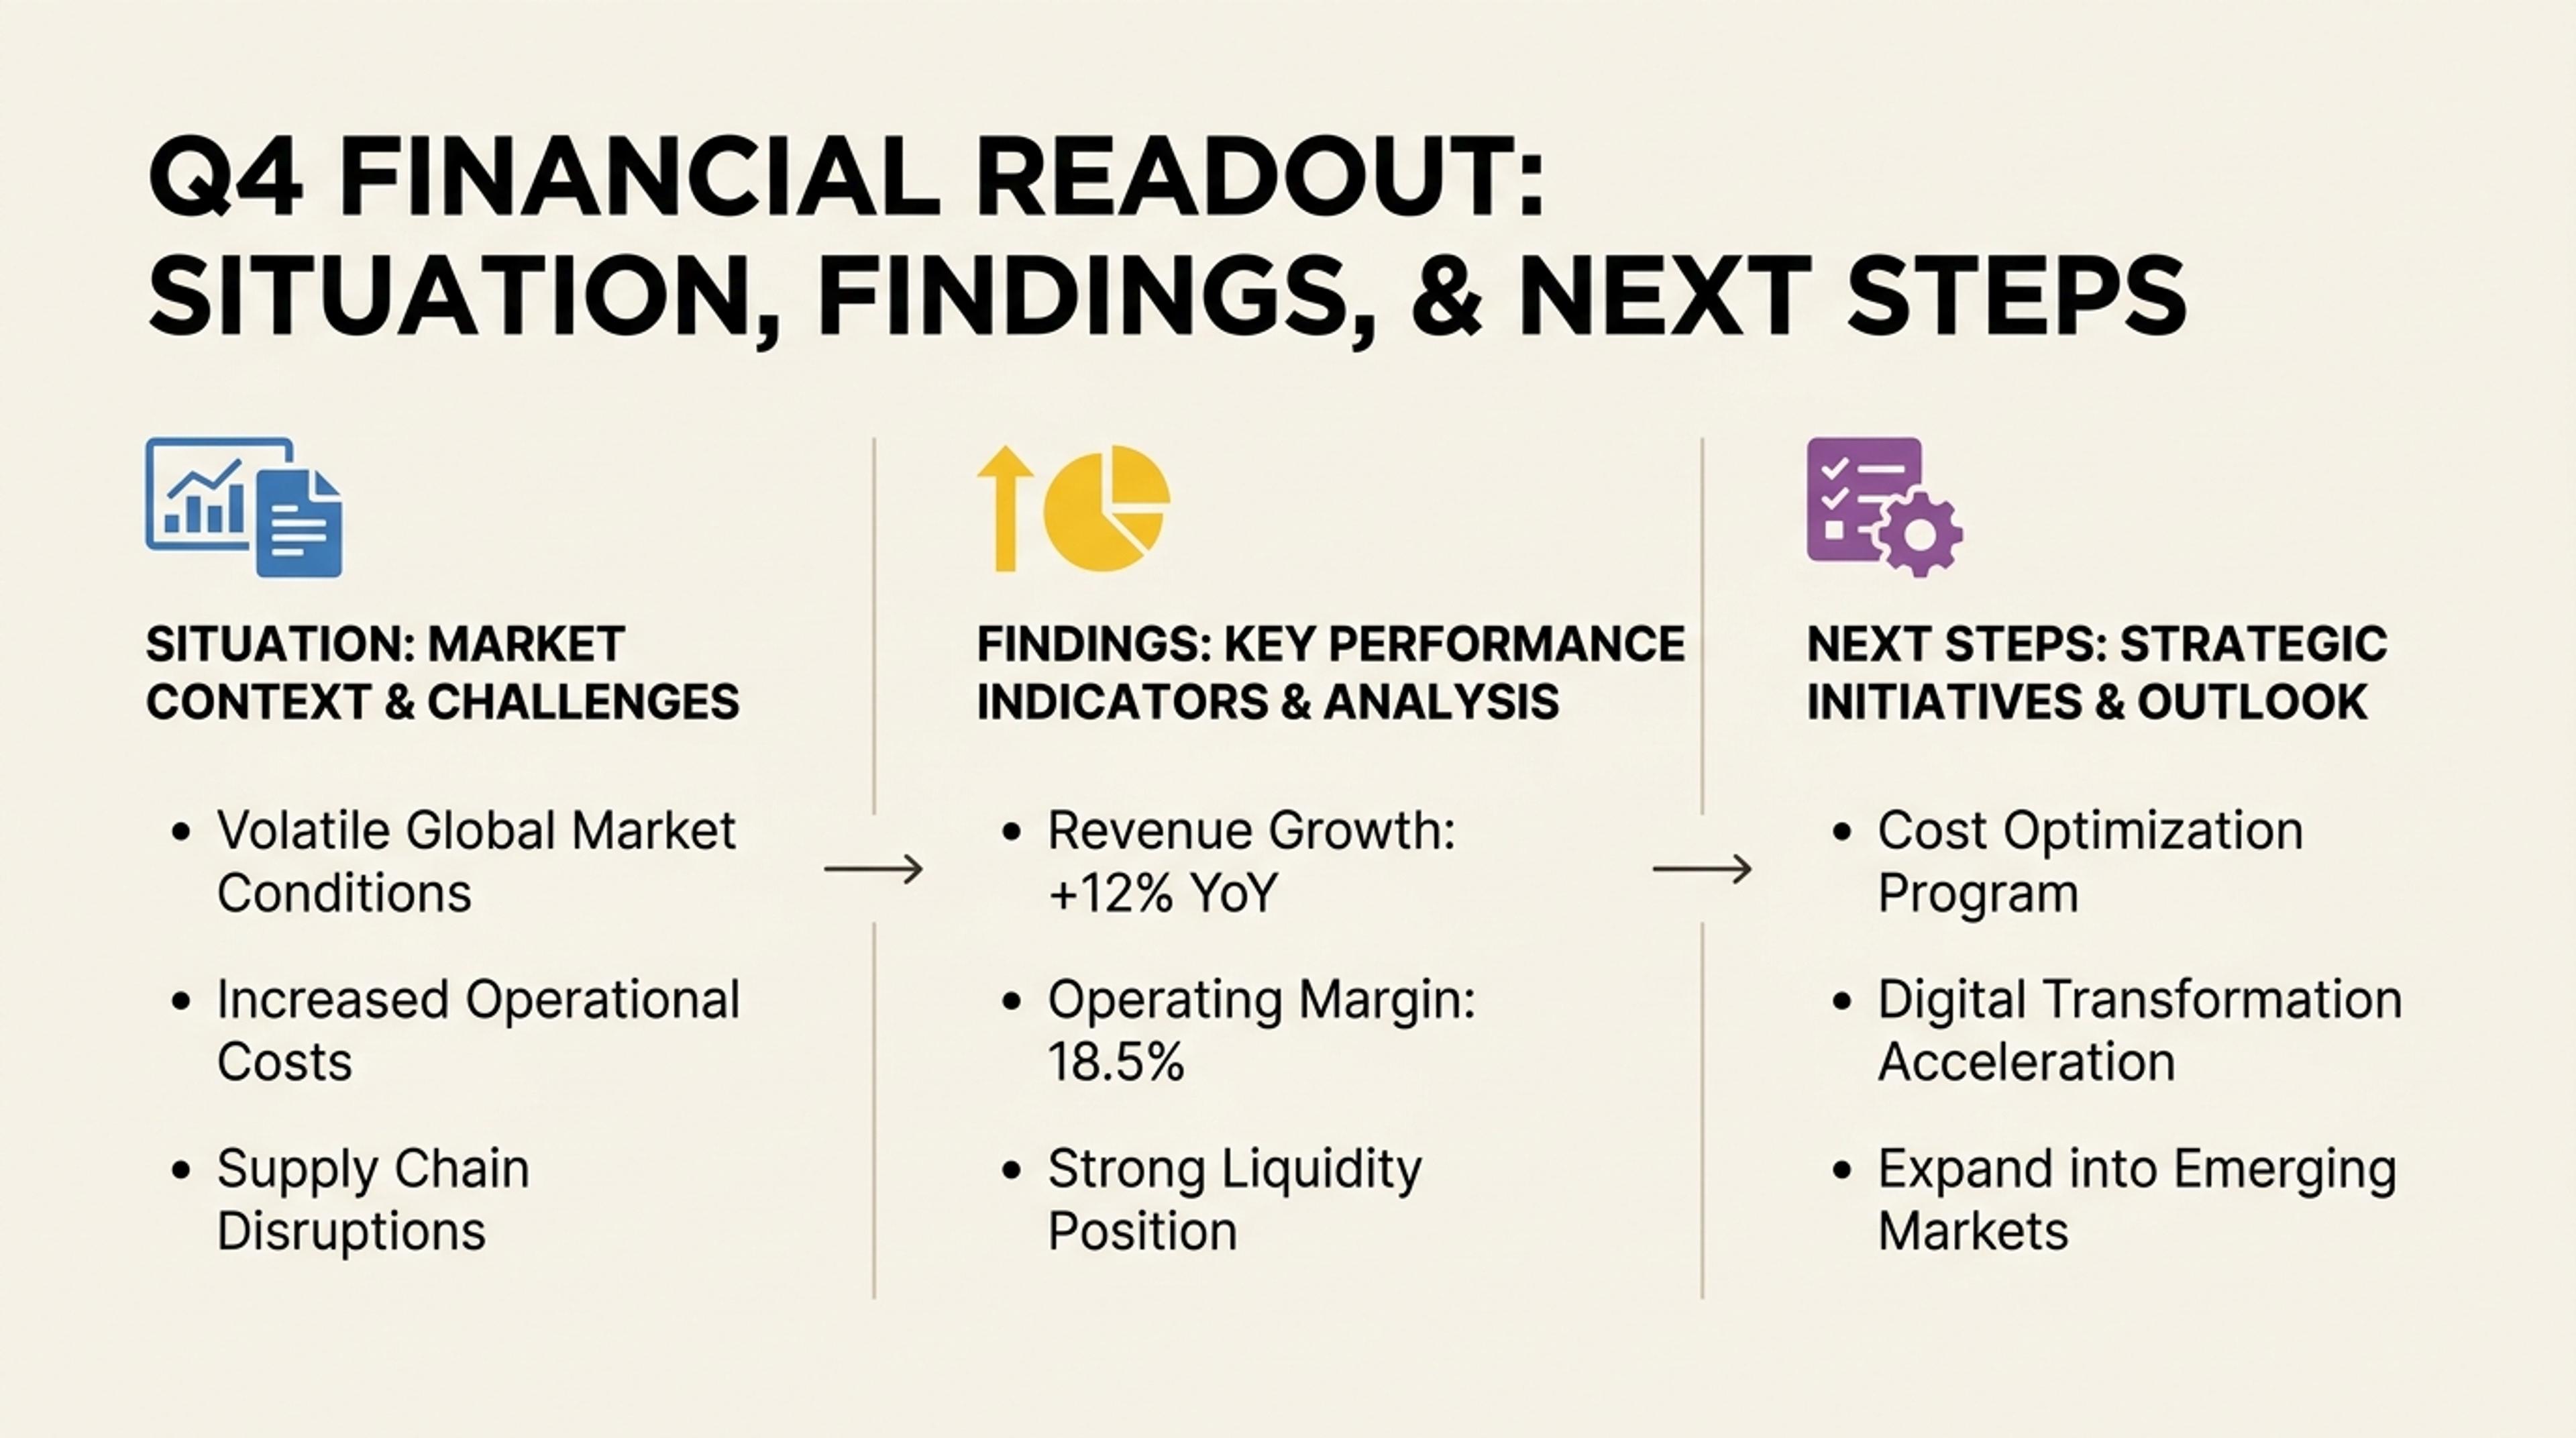
Translate month-over-month or budget-versus-actual changes into slides that highlight the drivers behind the numbers.
Move from statements and commentary to a deck centered on performance, drivers, variance, outlook, and decisions.
Surface revenue, margin, cash flow, growth, and the KPIs that define the reporting period.
Connect changes and variances to business drivers, segment performance, risks, and management commentary.
Close the deck with priorities, forecast context, recommendations, and the next actions for stakeholders.
Add the complete report with statements, notes, KPI tables, management commentary, and outlook sections.
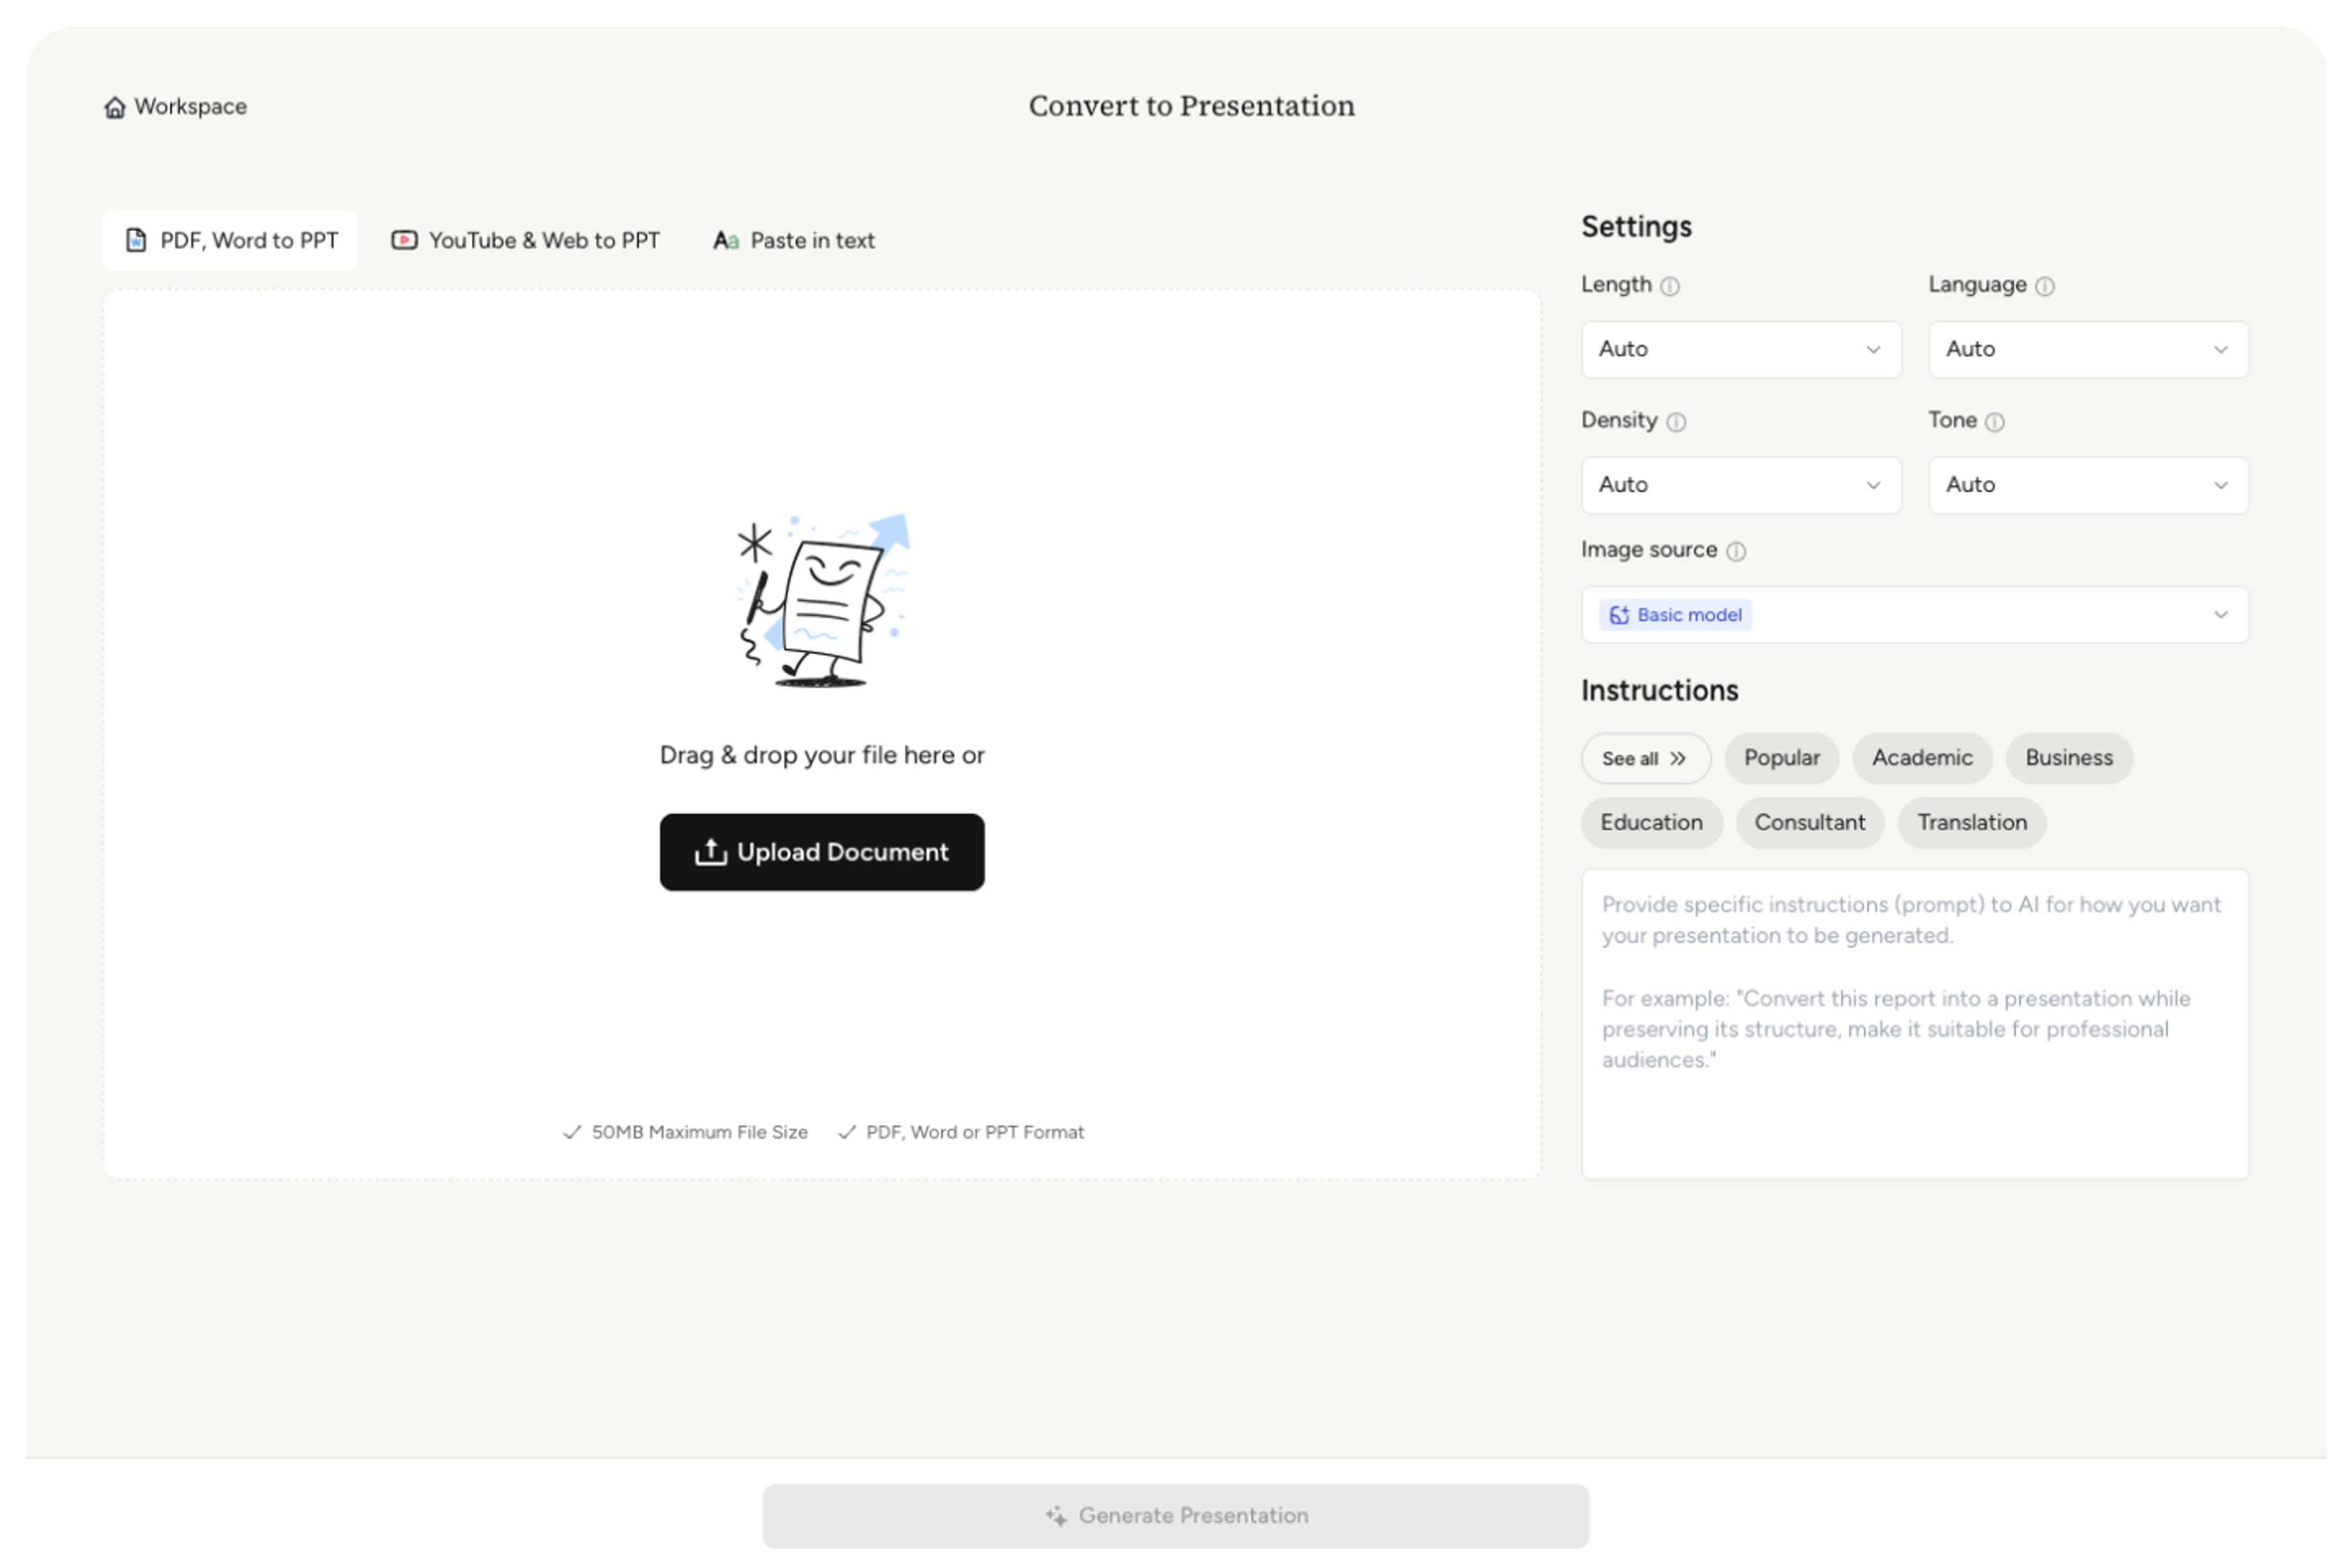
Set the deck for executives, board members, investors, finance teams, clients, or operating leaders.
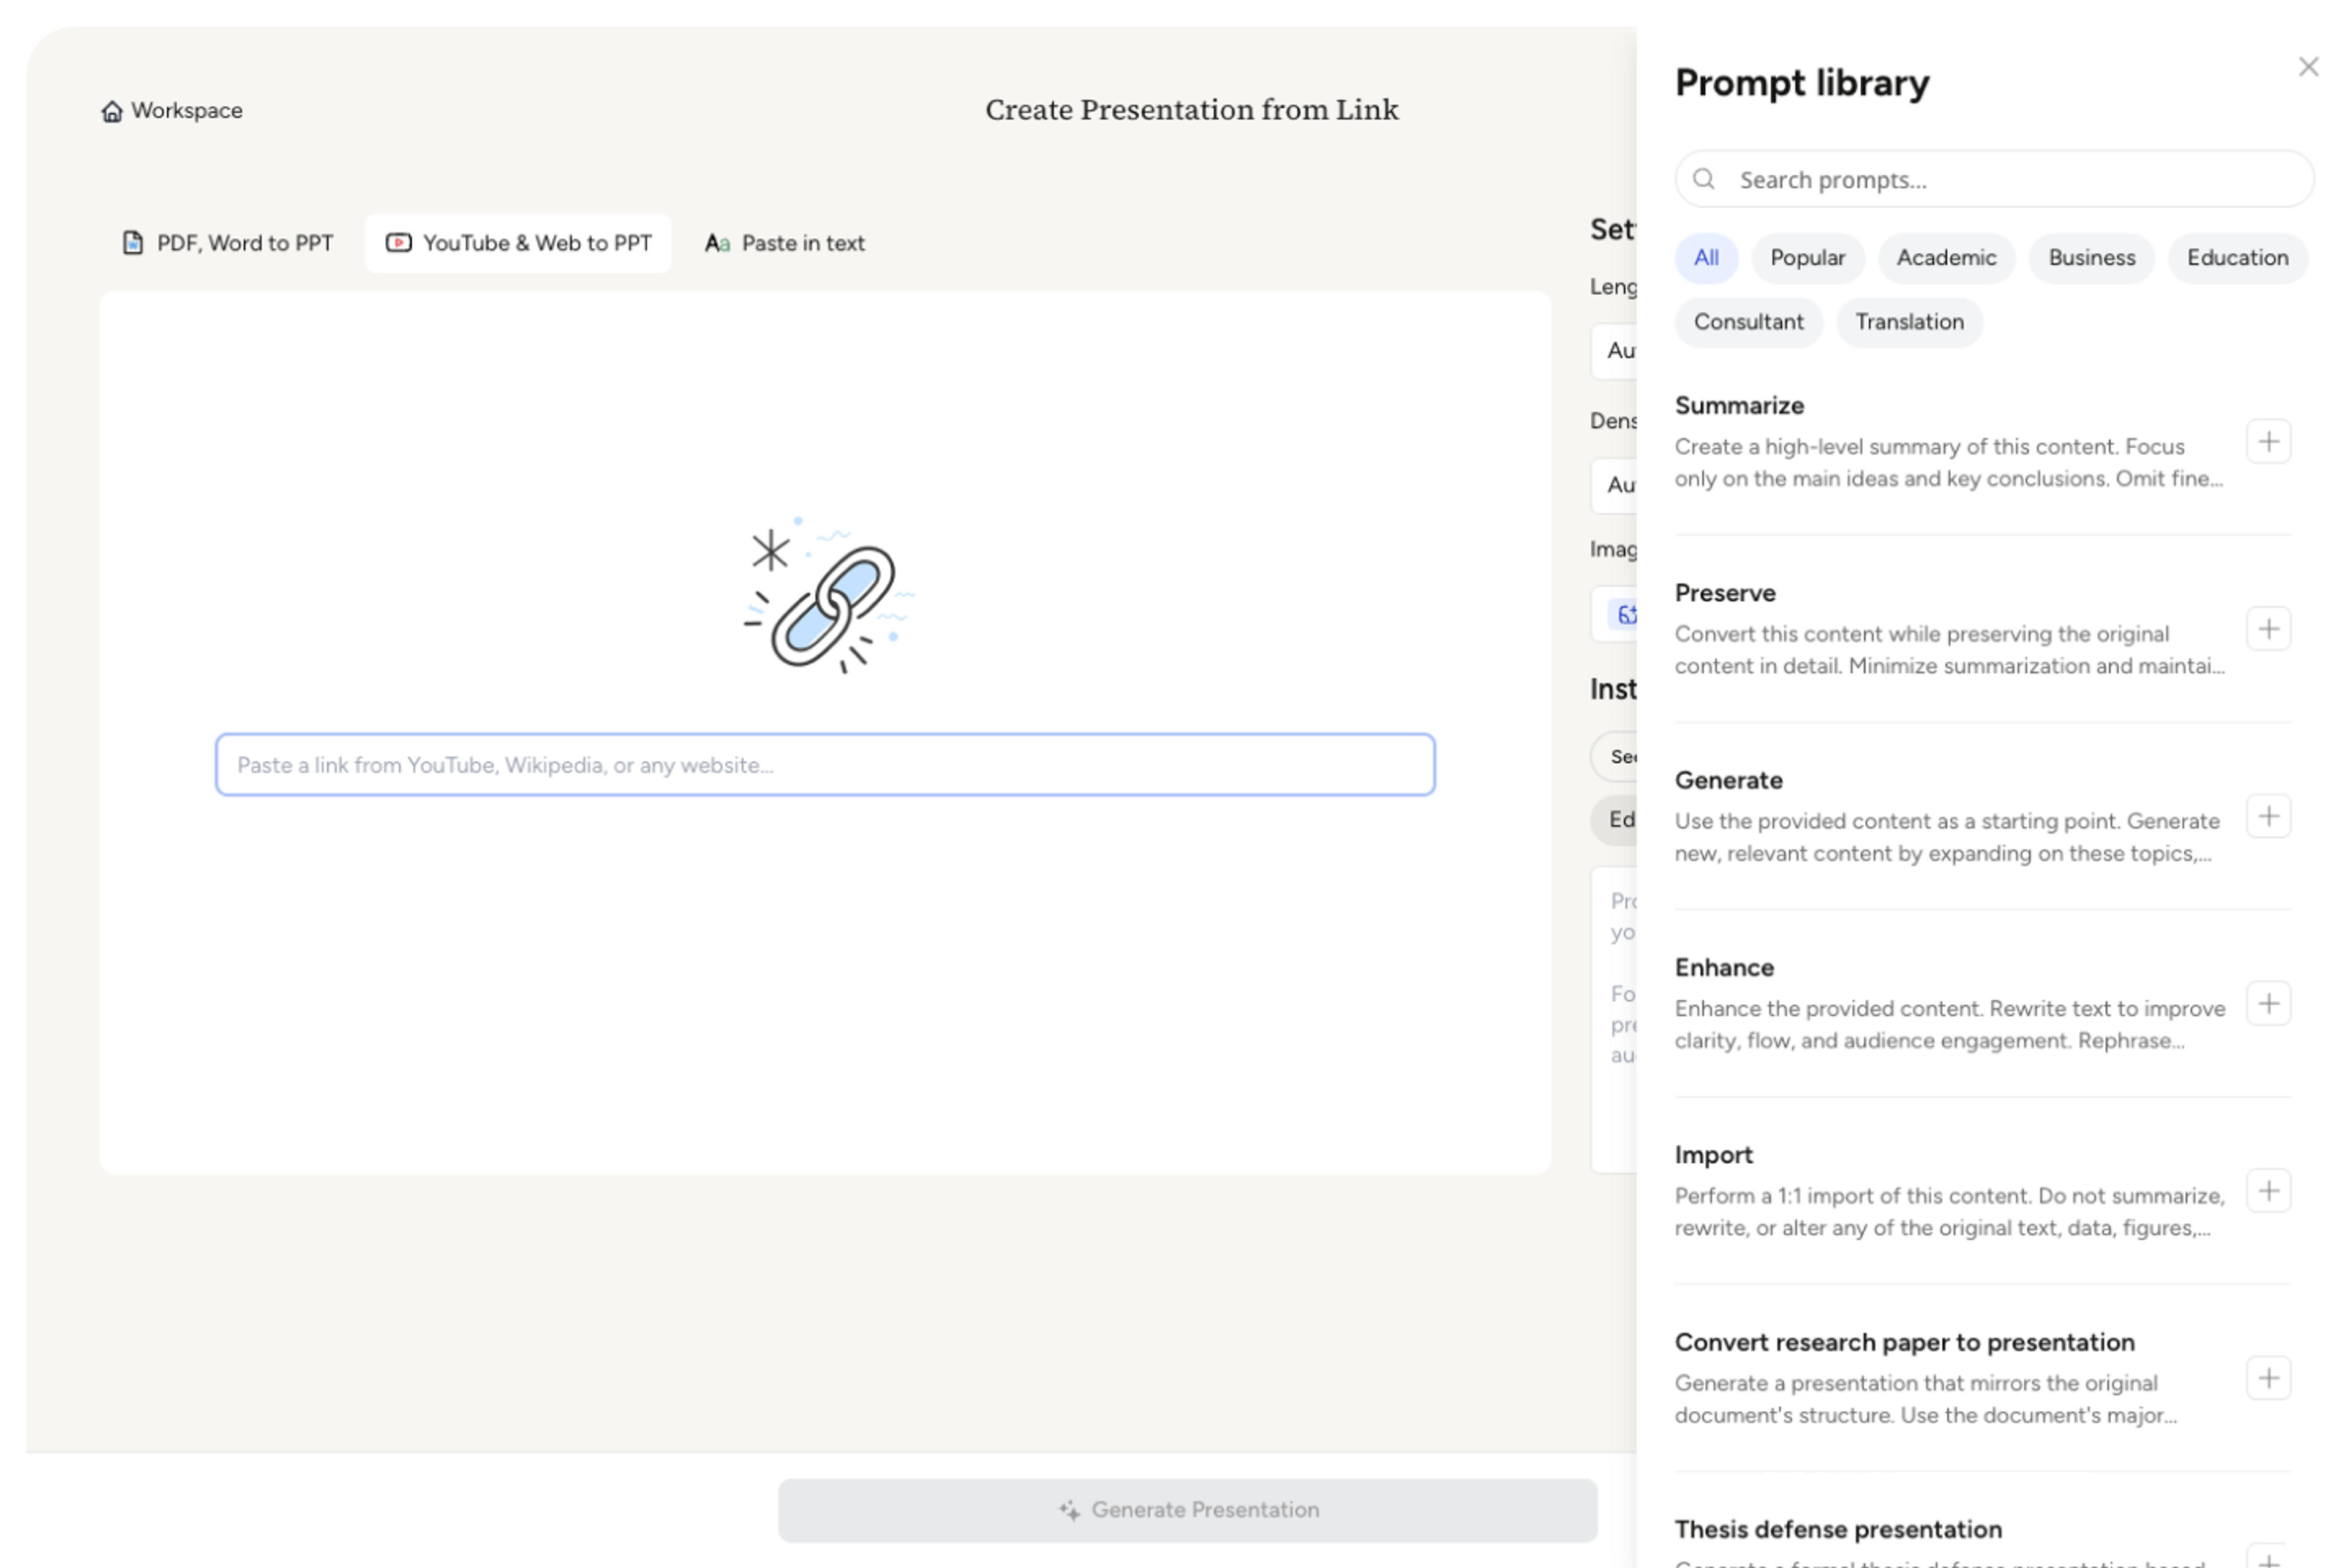
Select the KPIs, period comparisons, variances, segments, risks, and outlook points that matter most.

SlidesPilot builds a presentation from performance overview through drivers, segment detail, outlook, and action priorities.
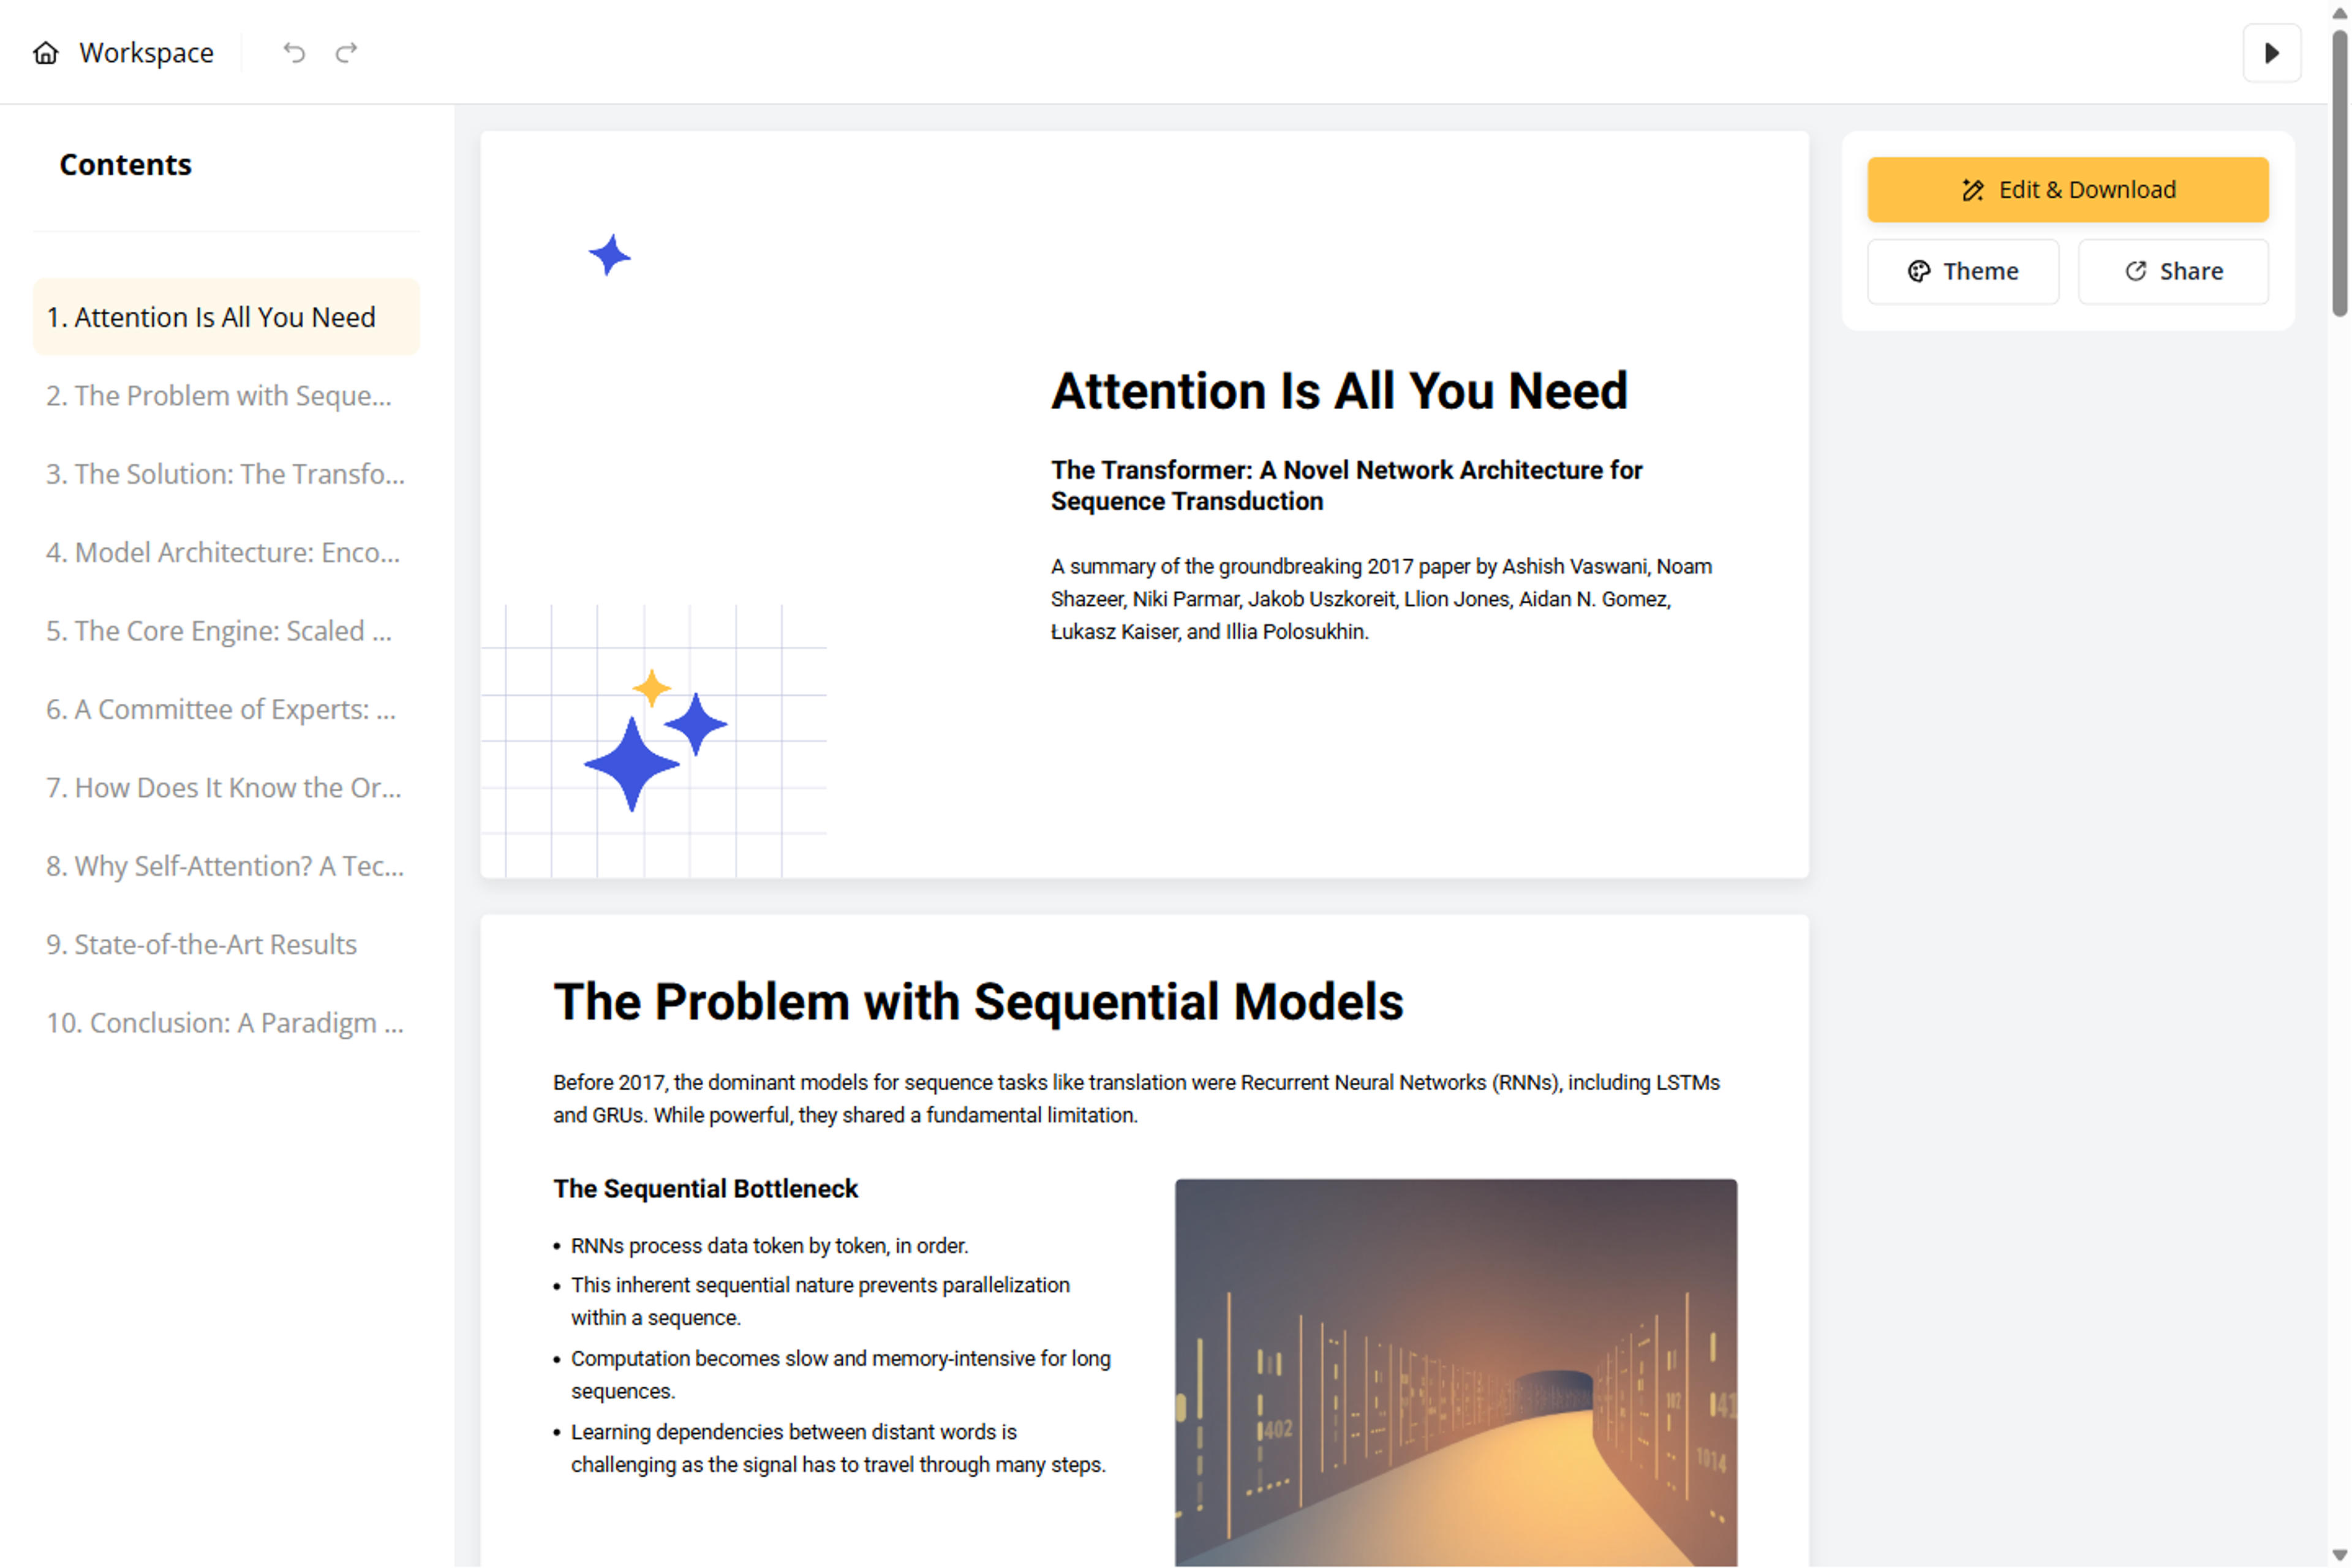
Polish numbers, labels, charts, commentary, branding, and conclusions, then export the editable presentation.
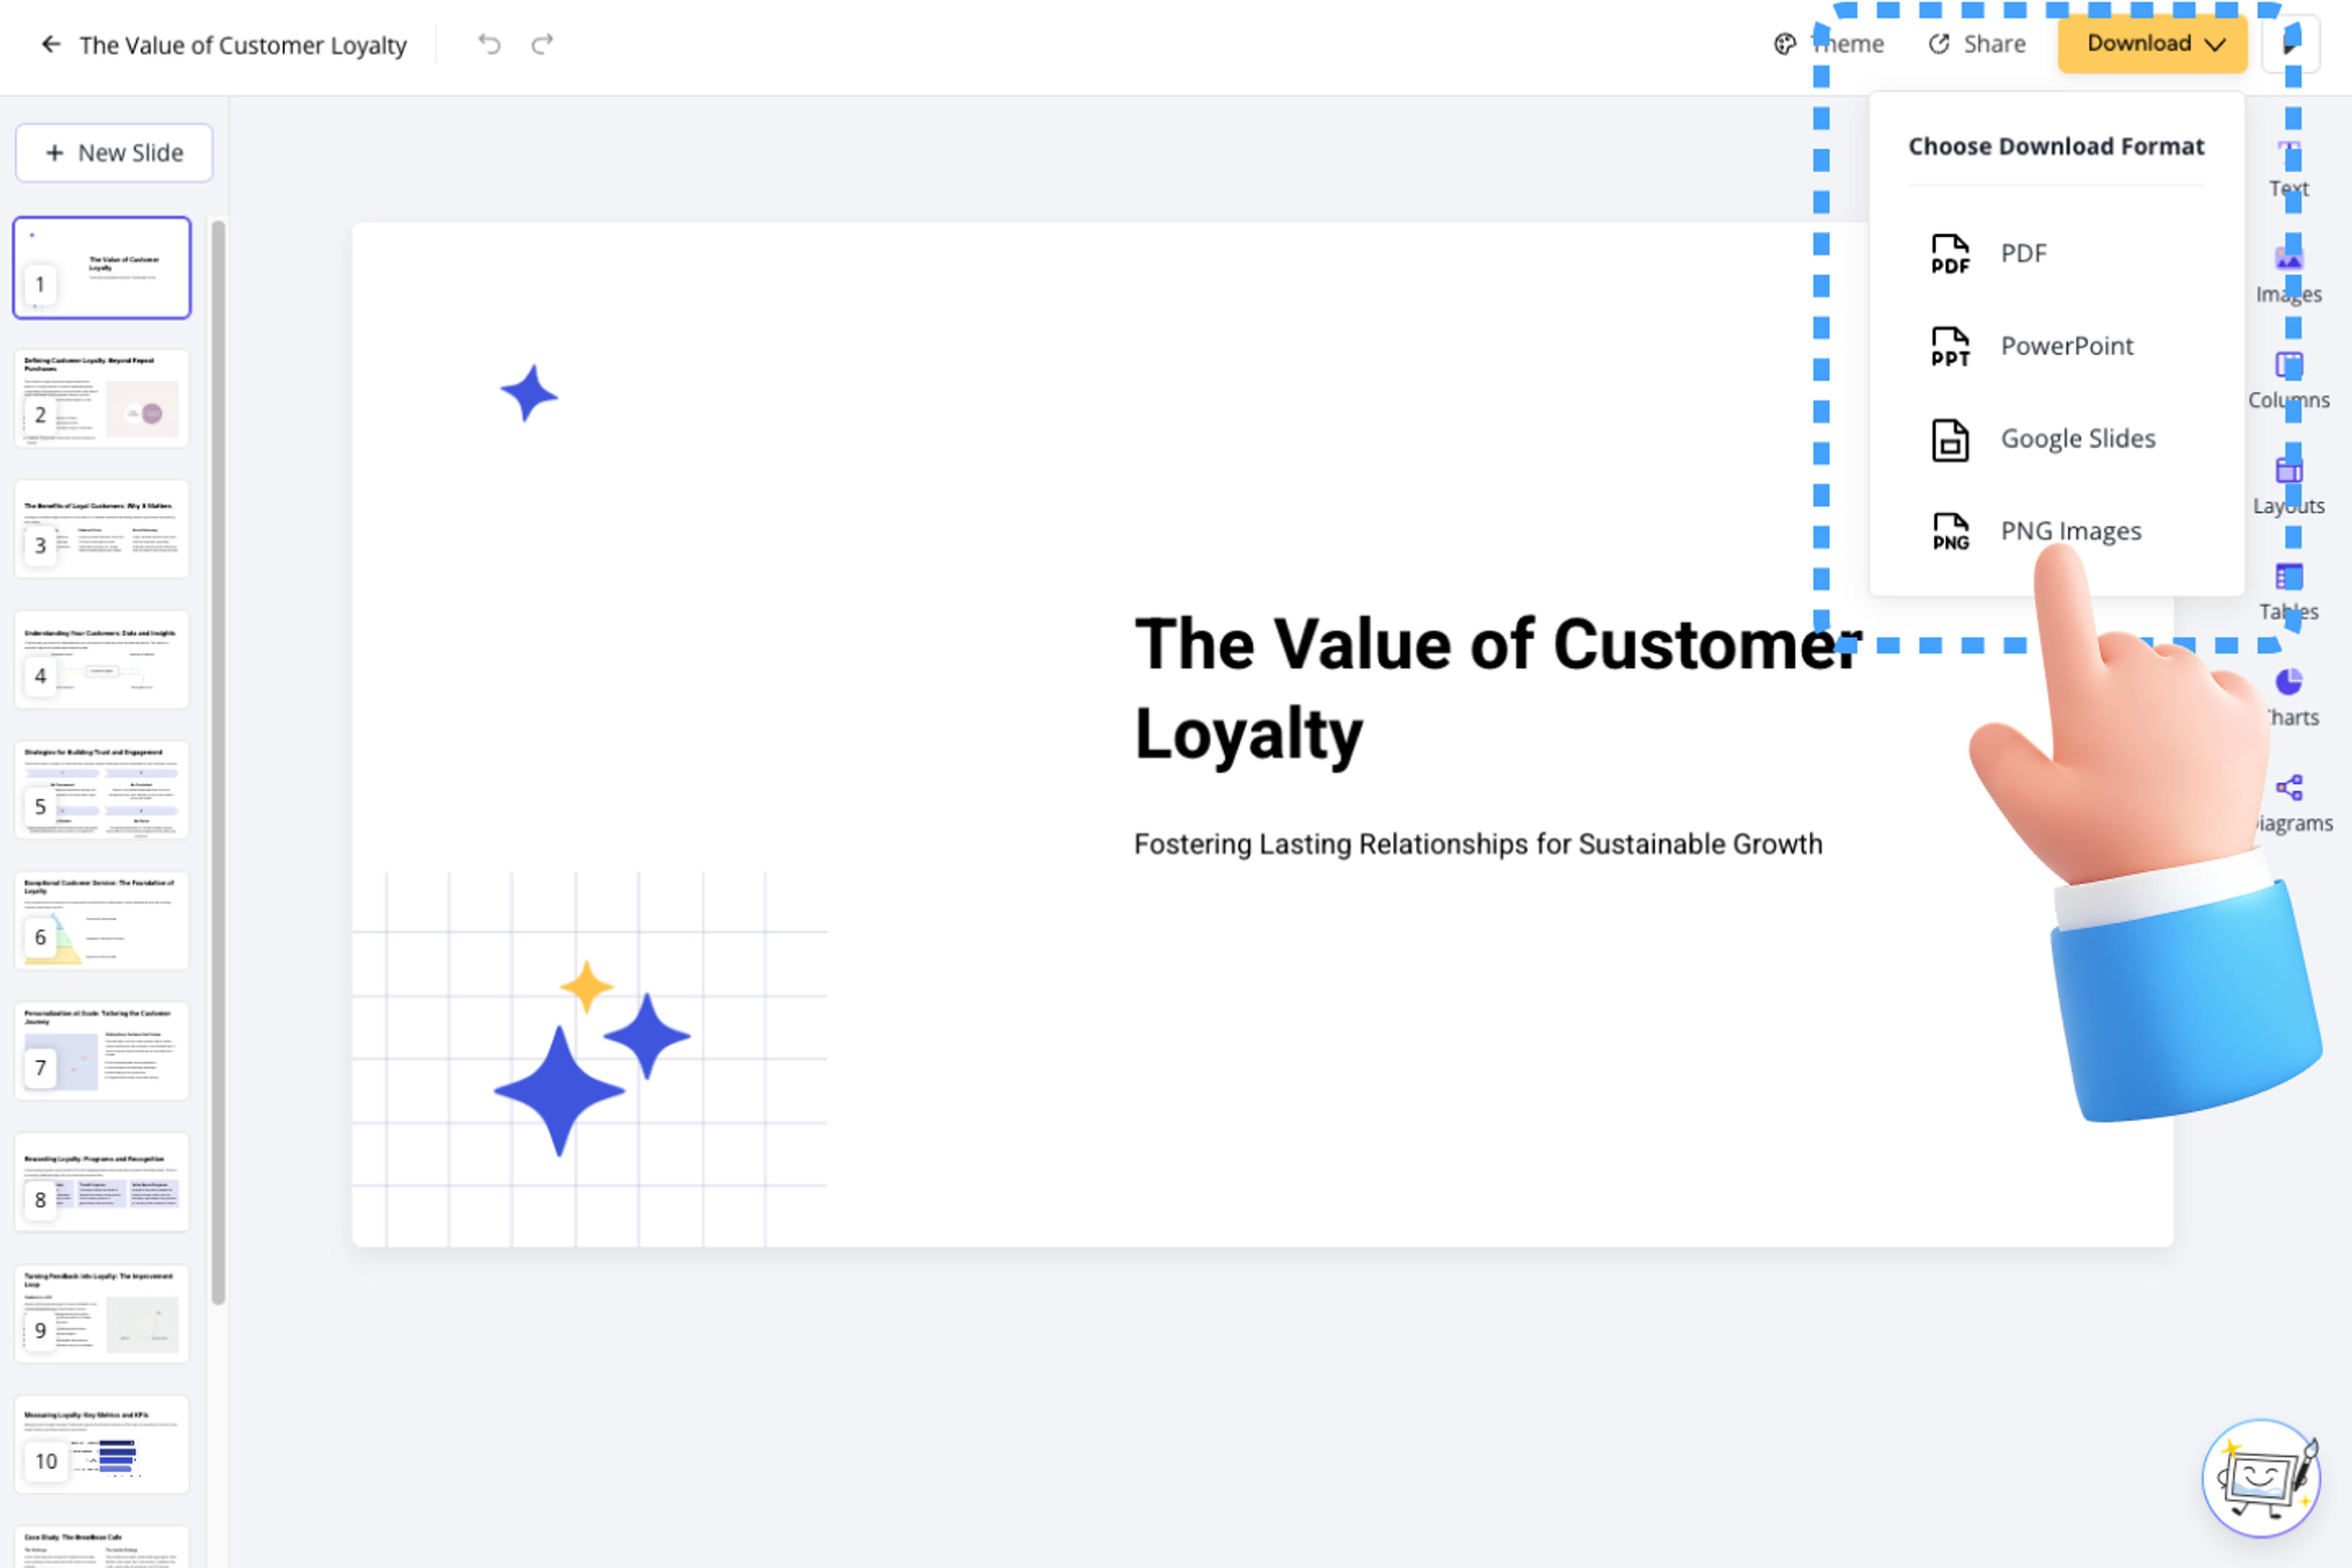
SlidesPilot organizes dense financial reporting around the metrics, drivers, and implications stakeholders need to understand.

Revenue, margin, cash flow, growth, and business-specific measures receive clear visual emphasis.

Current results, prior periods, targets, and forecast context become easy to compare.

Operational causes and management commentary connect directly to financial outcomes.

Business units, products, geographies, and customer segments receive focused coverage.

Forward-looking context and action items form a strong conclusion.

Refine charts, messages, disclosures, and branding for the final audience.
Use annual reports, quarterly reports, earnings material, management reports, budget reviews, variance reports, and KPI packs.
Yes. Prioritize revenue, profit, margins, cash flow, growth, segment results, and the metrics central to your business.
Yes. Build slides around year-over-year, quarter-over-quarter, budget-versus-actual, and forecast comparisons.
Yes. Set the audience and presentation time to focus the deck on performance, drivers, outlook, and strategic priorities.
Yes. Financial values, trends, and comparisons can be organized into clear visual evidence throughout the deck.
Yes. Refine the data story and design, then export an editable PPTX or continue in Google Slides.
Create presentations and concise briefs from financial reports, general reports, PDFs, Word files, and online sources.
Turn complex financial reporting into a clear executive summary
Transform detailed reports into executive PowerPoint presentations
Turn reports, papers, and documents into clear, structured, editable PowerPoint presentations with AI.
Turn Word documents into clear, structured, editable PowerPoint presentations with AI.
Turn articles, reports, and other web pages into clear, editable PowerPoint presentations.
Paste text, add a YouTube or webpage link, or upload a document to create a beautiful, structured summary connected to the source.
Transform your work into a presentation, instantly. ⭐ #1 AI PowerPoint Generator | Trusted by 3 million users worldwide