

Comparison Chart Examples: Turn Source Information into Clear Visual Comparisons
Choose the right comparison visual and follow original examples from source paragraphs to matched criteria and a clear presentation slide.
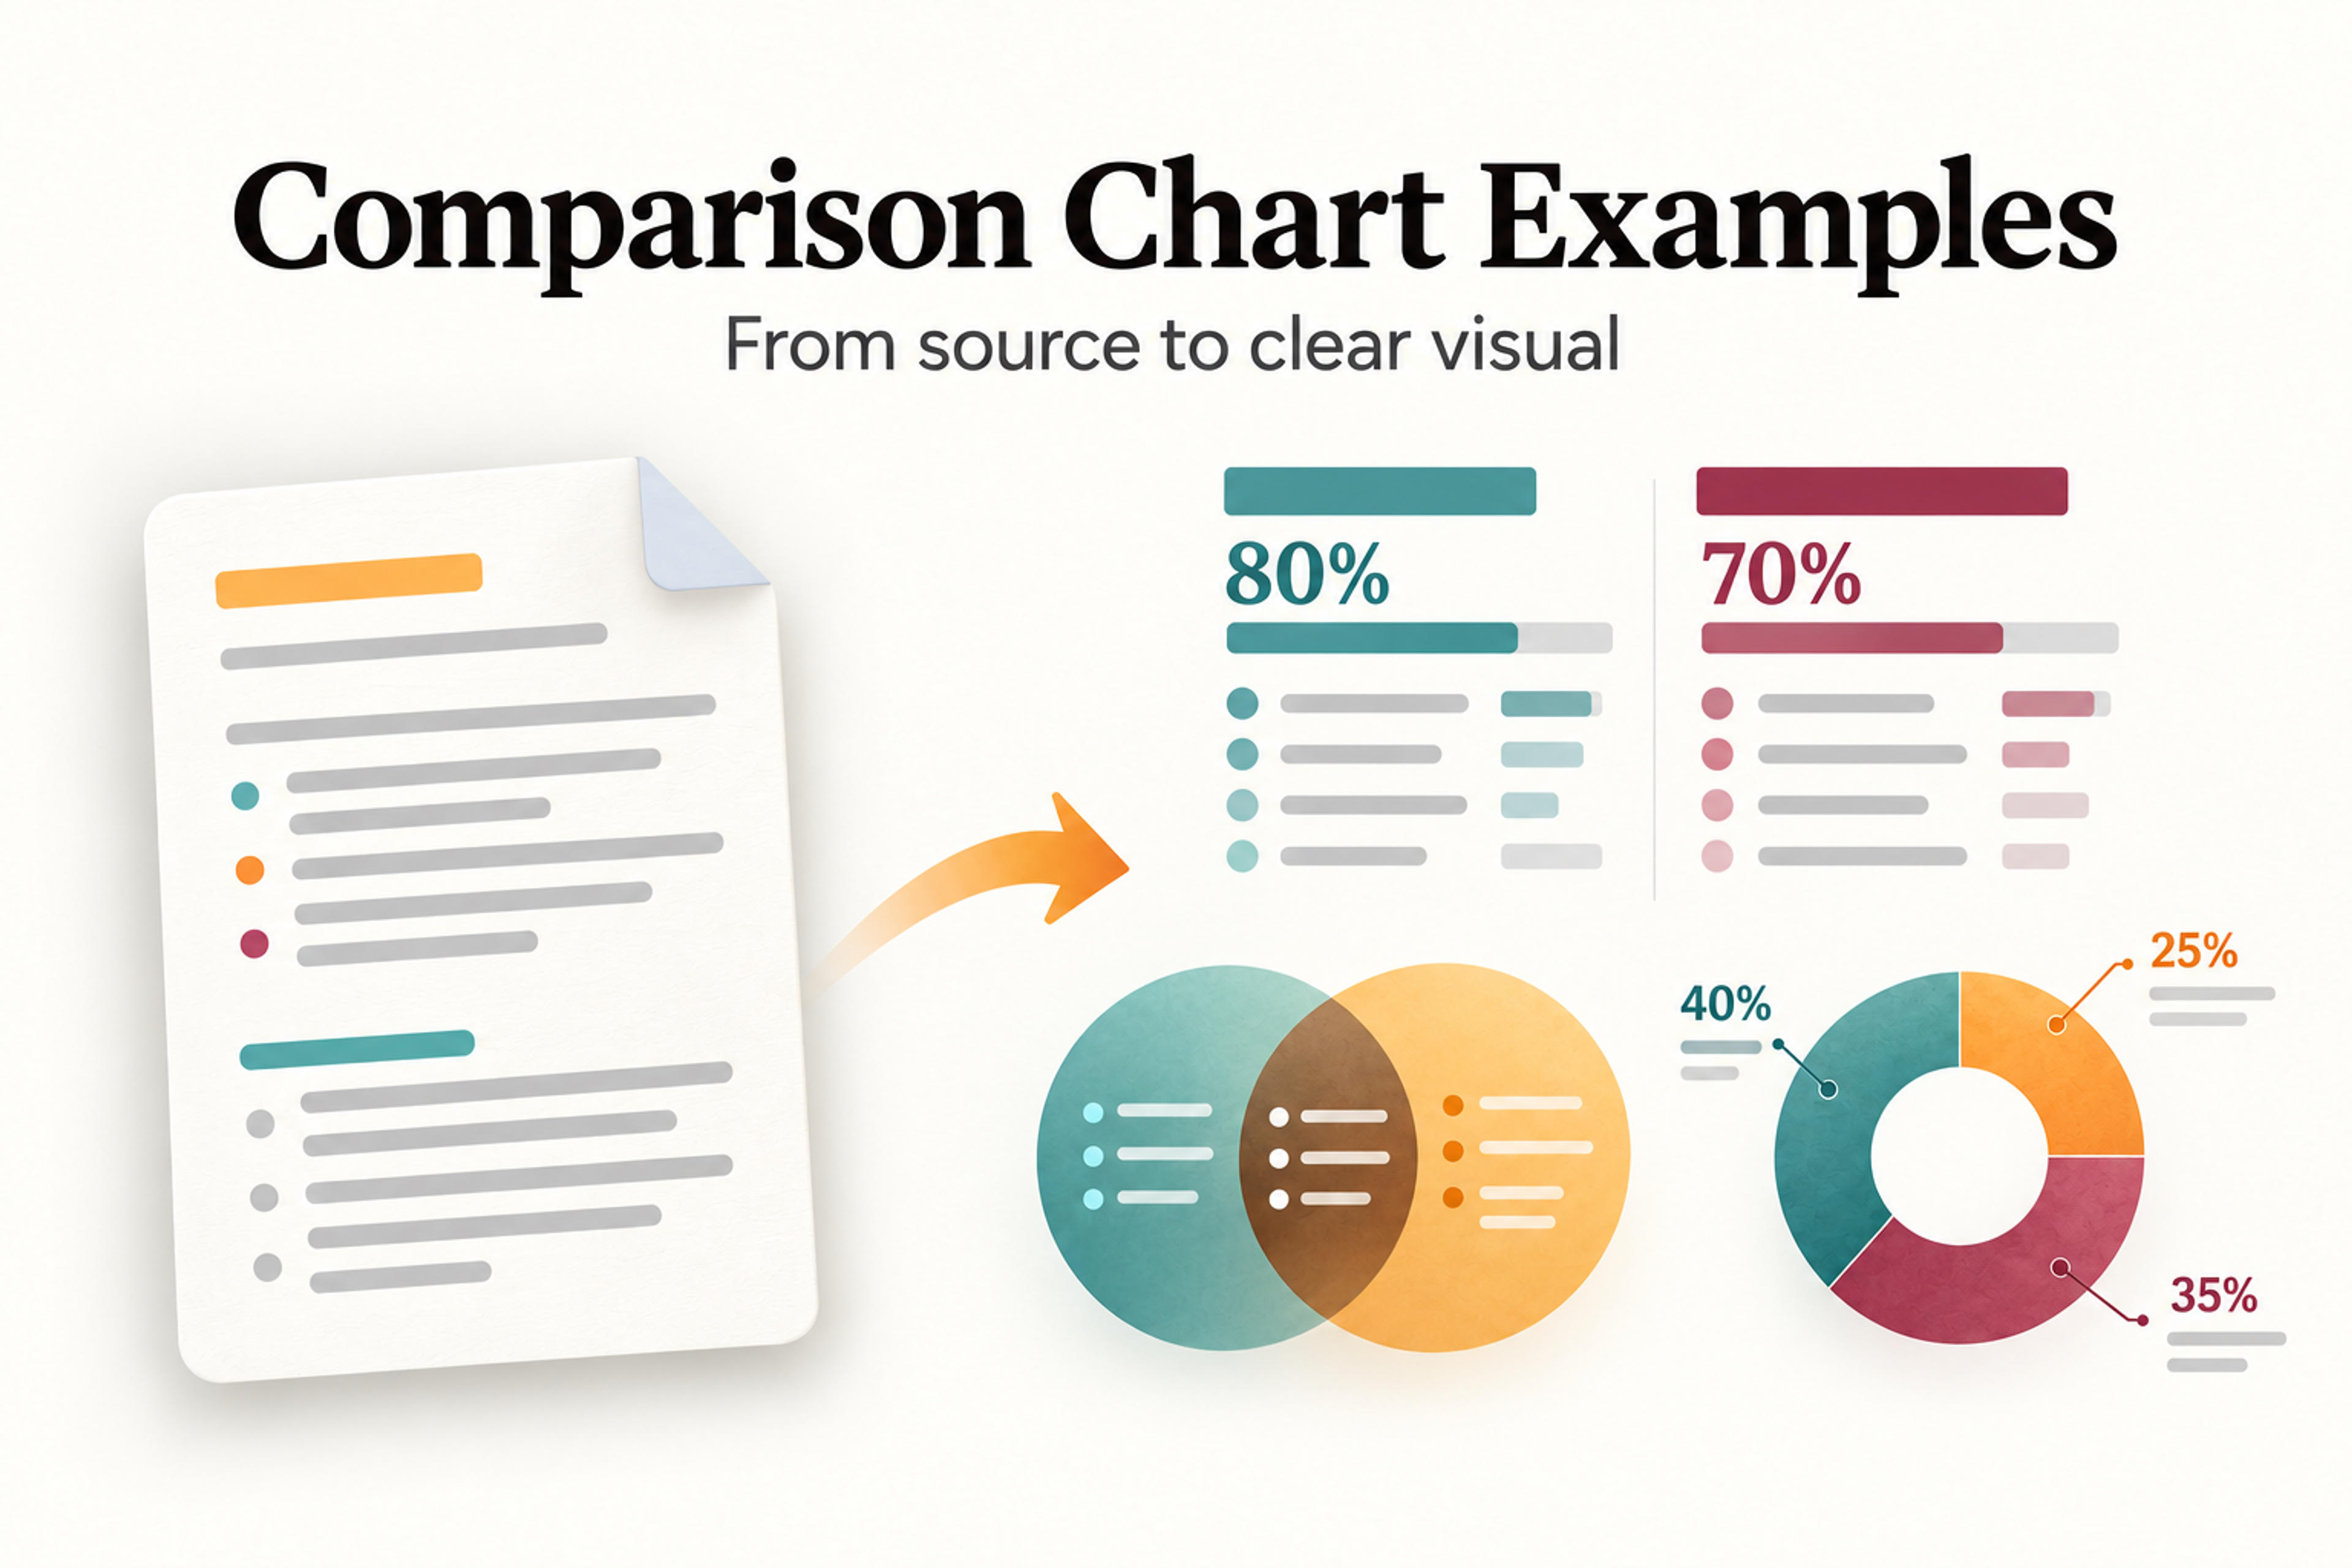
Choose the right comparison visual and follow original examples from source paragraphs to matched criteria and a clear presentation slide.
A comparison chart puts options next to each other so an audience can see the differences that matter. The strongest examples start with a clear question and shared criteria: what are we comparing, and what should the reader understand or decide?
If your information is buried in paragraphs, begin by extracting a comparison table. Then choose a visual that fits the message: a side-by-side infographic for tradeoffs, a Venn diagram for overlap, or a doughnut chart for shares of one total.
This guide shows how to move from source paragraphs to a criteria matrix and a finished presentation visual. The examples use fictional information so you can adapt the structure to your own lesson, proposal, or business presentation.
A useful comparison chart gives every option the same questions to answer. Instead of listing everything you know, select the criteria that affect the audience's choice.
For a consultant comparing proposals, those criteria might be scope, delivery time, cost, and client involvement. For a student comparing concepts, they might be purpose, defining characteristics, and shared features. For a presenter comparing regional plans, they might be coverage, launch stage, and available support.
Keep each criterion specific. “Delivery time” produces a clearer comparison than “Speed.” “Weekly facilitator time” is more useful than “Effort.” If a source does not give an answer, write “Not stated” in your working matrix rather than filling the gap with an assumption.
Your visual should make one takeaway easy to find. A title such as “Self-paced training offers flexible timing; live workshops add immediate feedback” tells the audience what the comparison means before they read the details.
The following formats are available in SlidesPilot's infographic selector. Each answers a different kind of comparison question.
| SlidesPilot format | Question it helps answer | Example |
|---|---|---|
| Comparison | How do options differ on the same criteria? | Two training approaches compared by schedule, feedback, and preparation |
| Venn | What is unique, and what is shared? | Shared and distinct requirements for two project teams |
| Statistical | Which figures should the audience notice? | Completion counts and rates for two training cohorts |
| Doughnut | How is one total divided? | A project budget split between research, production, and delivery |
| Geographic | Where do differences occur? | Regional launch plans with location-specific labels |
| SWOT | What strategic factors shape an option? | Strengths, weaknesses, opportunities, and threats for a proposal |
Choose Comparison when you need a qualitative comparison across matching criteria. Two aligned panels can show differences in requirements, benefits, costs, or responsibilities without forcing the audience to read long paragraphs.
Use the same labels in the same order on both sides. An option should not look stronger merely because its panel contains more detail or more enthusiastic wording.

Choose Venn when overlap is the main point. Place shared characteristics in the intersection and unique characteristics in the outer sections.
For example, a lesson might compare two writing assignments: both require evidence and a clear argument, while one requires field interviews and the other requires a literature review. The overlap explains what students can reuse; the outer sections explain what changes.

Choose Statistical for a numerical summary with a small set of important figures. Give each number a clear label, unit, and period.
For example, suppose two fictional training cohorts each enrolled 50 people. Cohort A had 40 completions, or 80%; Cohort B had 35, or 70%. A statistical infographic can emphasize both rates and their denominators. The completion-rate difference is 10 percentage points, not 10%.
Choose Doughnut when the categories make up one total. It suits allocation questions such as “Where will the project budget go?”
Use a few distinct categories, label the values, and state the total. Two unrelated amounts do not become parts of a whole simply because you place them in a ring.

Choose Geographic when the audience needs to connect information to places. For example, a rollout presentation could label the East region “Pilot,” the Central region “Preparation,” and the West region “Next phase.”
Keep the labels consistent across locations. If you compare numerical results, include the unit and time period alongside each place. Treat the map as a way to locate the information; the labels carry the comparison.

Choose SWOT when you need to organize strengths, weaknesses, opportunities, and threats. Strengths and weaknesses describe internal factors; opportunities and threats describe external conditions.
A single SWOT evaluates one option. To compare two proposals, give each its own SWOT with the same level of detail, then explain the decisive tradeoff. A long list in one quadrant does not establish that an option is better.
Paste your notes, upload a document, or add a link. Choose an infographic format and use SlidesPilot to turn your source material into a visual comparison.
Create My InfographicA comparison table is the working structure: rows hold criteria and columns hold options. It keeps exact facts aligned and makes missing information visible.
A bar chart compares numerical magnitudes through bar length. That is a different job from a qualitative comparison. It is not a named template in the infographic selector shown here, so the workflow below uses the available Comparison, Statistical, and Doughnut formats.
A comparison infographic turns selected facts into a visual explanation, using panels, labels, and emphasis to make the main tradeoff easy to understand. Build the matrix first; use the infographic to present its most useful findings.
Imagine you need one slide to help a team choose between self-paced training and a live workshop. Your starting point is two paragraphs.
Self-paced training: Participants complete three recorded modules during a two-week window. They can choose when to study. Questions go to a discussion board, and a facilitator replies within two business days. Preparation includes recording the modules and writing practice exercises.
Live workshop: Participants attend one three-hour session at a fixed time. They practice in small groups and ask the facilitator questions during the session. Preparation includes a session plan and group activities.
These descriptions contain useful differences, but the information is not yet aligned. Choose criteria that answer the decision: which approach fits the team's scheduling and feedback needs?
| Criterion | Self-paced training | Live workshop |
|---|---|---|
| Schedule | Flexible timing within two weeks | One fixed three-hour session |
| Learning activities | Recorded modules and practice exercises | Small-group practice |
| Feedback | Discussion-board reply within two business days | Questions answered during the session |
| Preparation | Record modules and write exercises | Plan the session and group activities |
The matrix makes four matched comparisons. It also preserves the distinction between the two-week completion window and the three-hour session; those figures measure different things and should not be presented as a direct duration contest.
Use two panels with the same four labels. Shorten the entries enough to scan, while retaining details that affect the choice, such as the feedback timing.
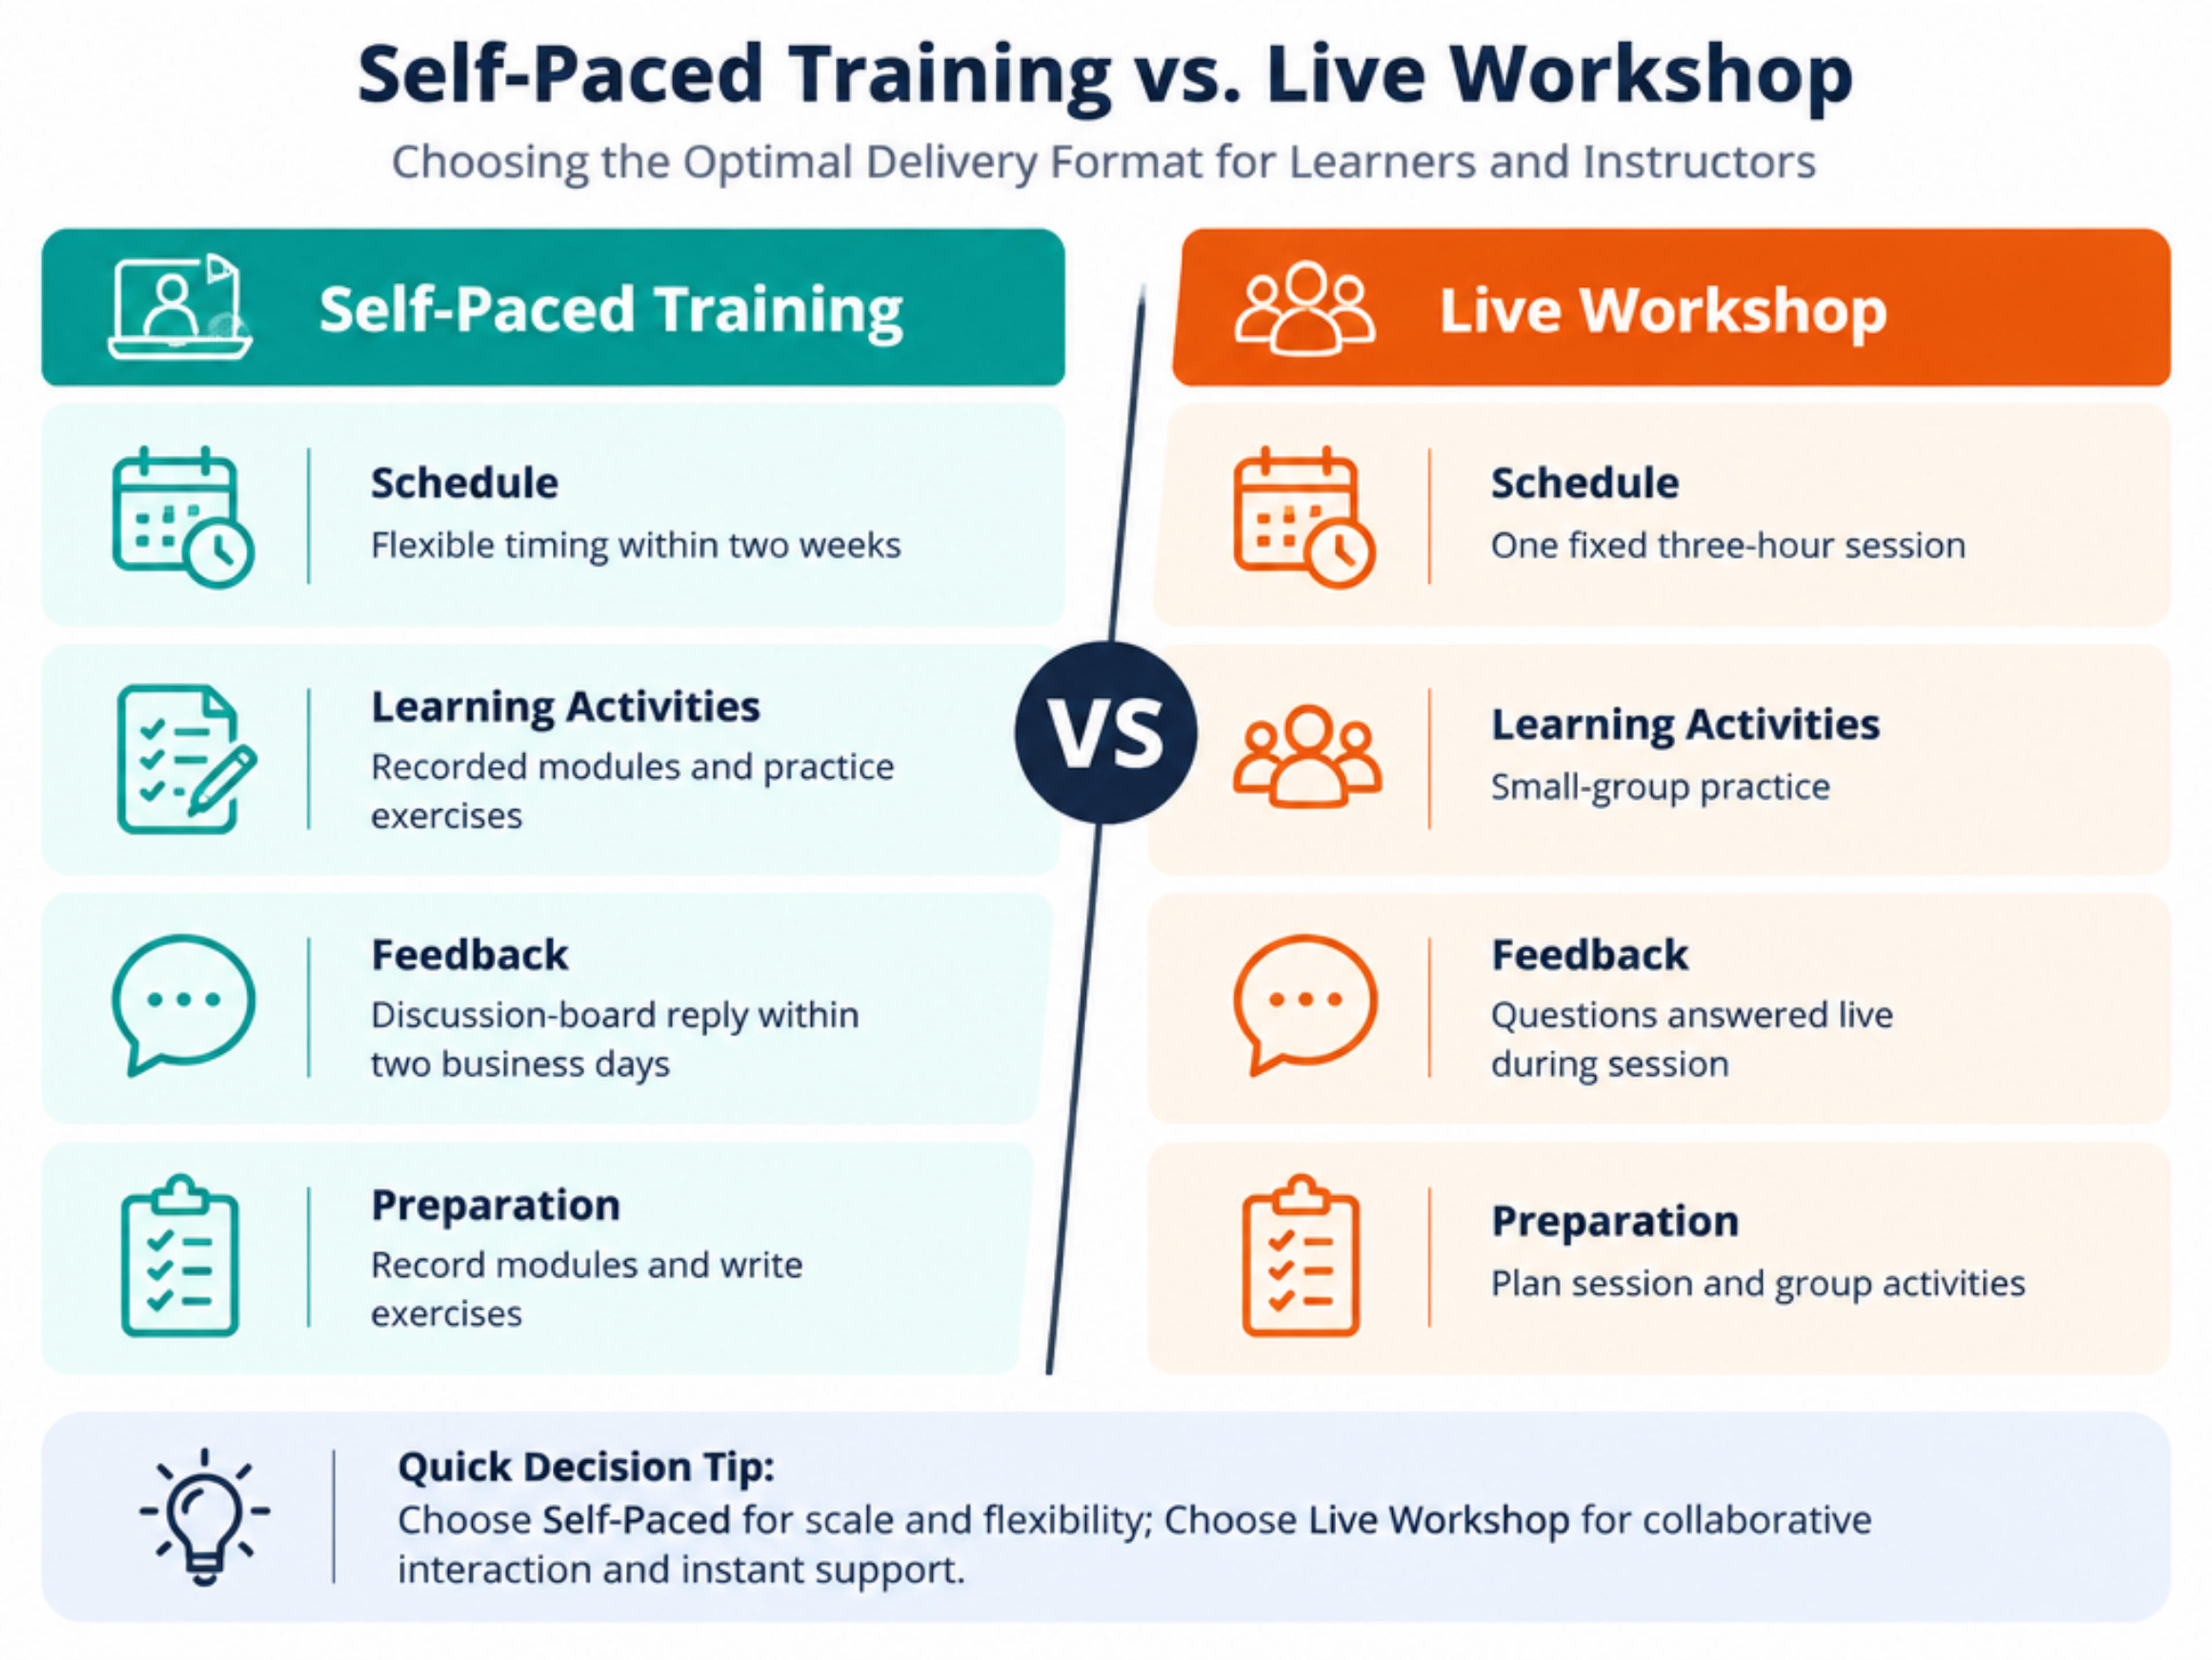
This illustrative final layout uses the fictional source above. Its takeaway is specific: self-paced training offers flexible scheduling; a live workshop offers immediate feedback. Neither approach is declared universally better.
Here is a reusable brief for the Comparison format:
Create a Comparison infographic for a team choosing a training approach. Compare self-paced training and a live workshop using Schedule, Learning activities, Feedback, and Preparation, in that order. Use only the supplied facts. Keep the labels aligned and the wording short. Title the visual “Flexible scheduling or immediate feedback?”
Paste the source paragraphs or the completed matrix with that brief. You can reuse the same structure for two consulting proposals, two course formats, or two project approaches by replacing the facts and decision criteria.
Consider a fictional $10,000 project budget: $4,000 for research, $3,500 for production, and $2,500 for delivery. The question is how the budget is allocated across the three activities.
| Category | Amount | Share of total |
|---|---|---|
| Research | $4,000 | 40% |
| Production | $3,500 | 35% |
| Delivery | $2,500 | 25% |
| Total | $10,000 | 100% |
A Doughnut chart shows these categories as parts of the same budget. Put the $10,000 total in the center and pair each category with its percentage and dollar amount.
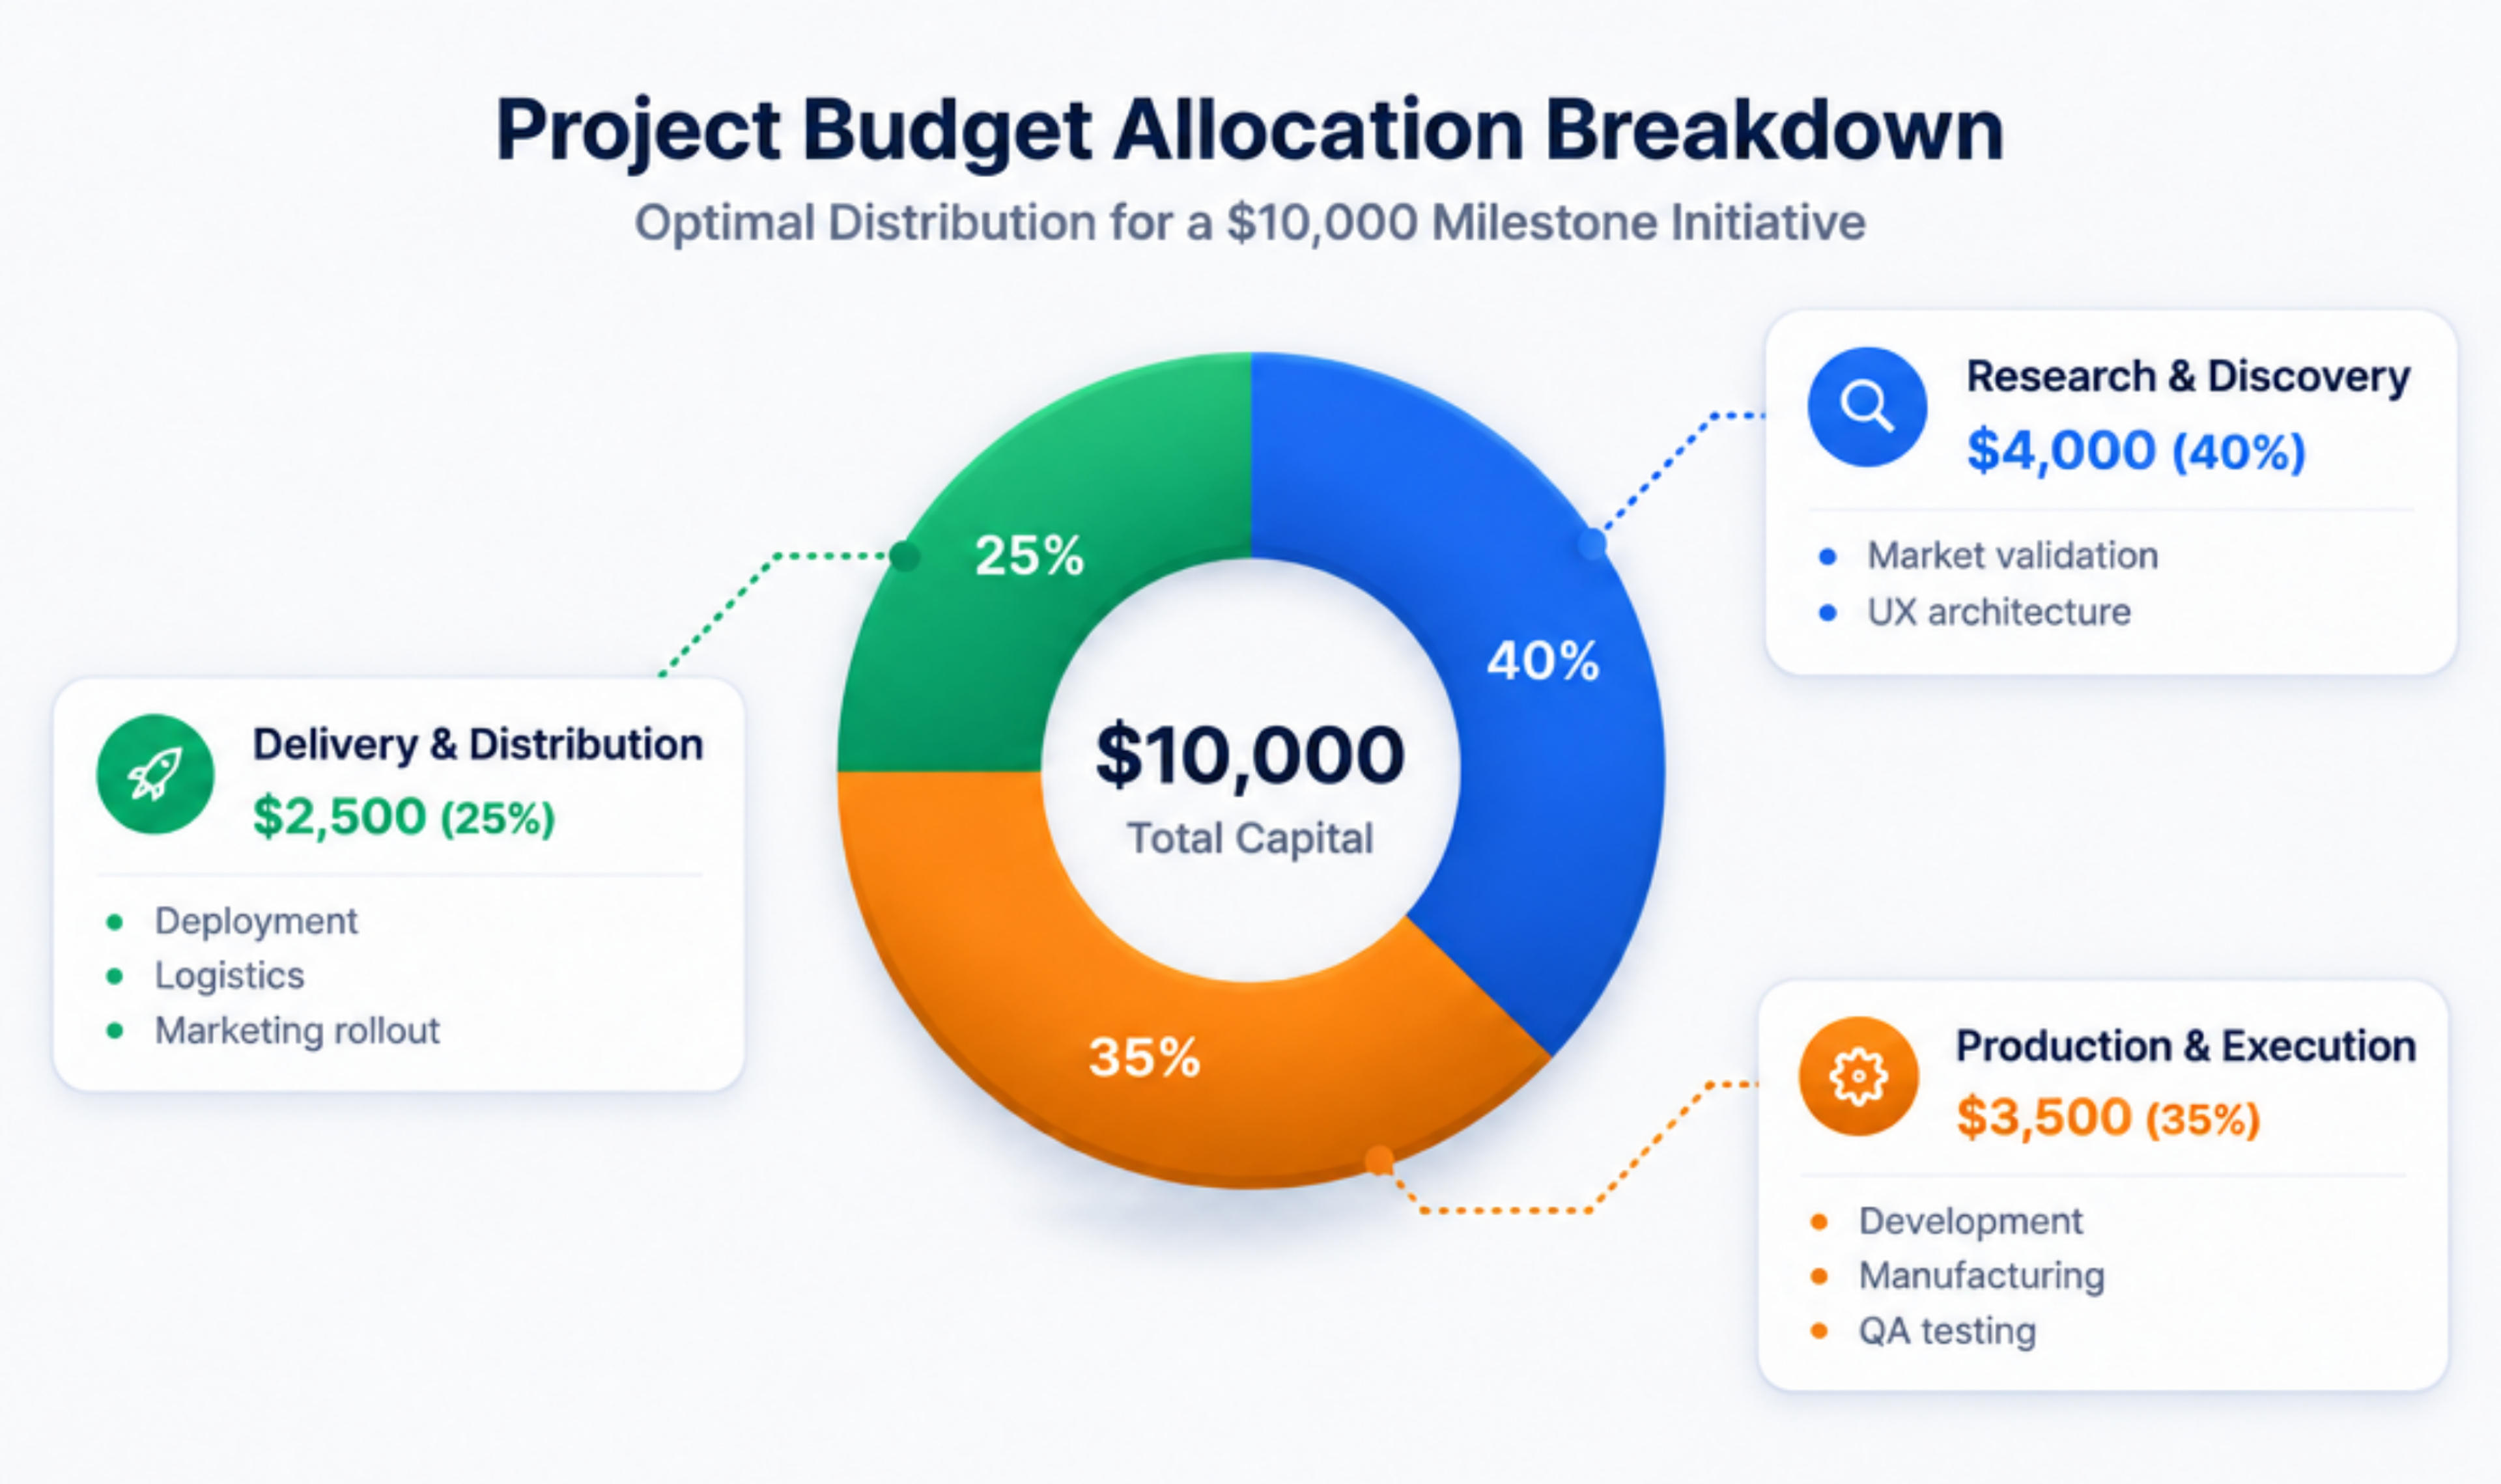
The visual answers the allocation question without implying an outcome. Research receives the largest share; that does not establish that it will deliver the greatest return.
SlidesPilot's infographic workflow accepts topics, notes, documents, and links as starting material. Use your matrix to give the visual a clear purpose and a consistent set of facts.
Write one sentence stating the job: “Help a client compare two delivery approaches” or “Help students understand what two concepts share.” That sentence guides both the criteria and the format.
If your material is a long report, select the relevant passages before designing the comparison. You can also use the AI summarizer to organize source material before building your matrix.
On the Create an Infographic screen, select Comparison for aligned tradeoffs, Venn for overlap, or Doughnut for shares of a total, then select Next. Use the other formats in the guide when their question matches your material.
Include the options, matched criteria, source information, and intended takeaway. For numerical information, add units, denominators, and the period covered. For qualitative information, use comparable descriptions rather than scoring an option with unexplained stars or points.
Keep instructions separate from source facts. “Emphasize immediate feedback” is a design instruction; “questions answered during the session” is a source fact.
Review the generated visual against your matrix. Shorten a sentence without changing its meaning, keep criterion labels consistent, and give the main finding the strongest emphasis. SlidesPilot's public infographic workflow describes revising labels and wording; use those refinements to make the visual fit your audience.
Introduce the decision before the comparison slide and follow it with the implication. In the training example, the next slide might explain which approach fits the team's availability and need for facilitator feedback.
For a fuller narrative, the AI presentation generator can help turn the topic into a deck. If your comparison belongs inside an existing report, use the relevant PDF-to-presentation or Word-to-presentation workflow to build the surrounding story.
When a new proposal or lesson arrives, reuse the decision question and criteria, replace the source facts, and create the next comparison. Consistent criteria make related presentations easier to discuss.
Include the options, the same criteria for each option, concise factual entries, and a title that states the main finding. Add units and dates when comparing numbers. Keep supporting detail in the source or working matrix.
Start with the audience's question. Select criteria that could change the choice or clarify the concept. For two proposals, scope and delivery responsibilities may matter more than a long list of features. For two lesson concepts, defining traits and shared characteristics may be the better fit.
Yes. A Venn diagram compares shared and unique characteristics. Use it when the overlap carries the message; use Comparison when the audience needs to scan matching criteria side by side.
Use it when your categories divide a single total, such as a budget or a set of responses. State the total and label each share. For figures that do not form one whole, use a format that keeps their meaning separate, such as a Statistical infographic with clear labels.
Yes. Identify the options, extract the same criteria for each, and organize the facts into a matrix. Then choose a visual format. The training example above shows the full sequence from prose to a presentation-ready comparison.
Start your next comparison chart with the information you already have: choose the question, align the criteria, and turn the most meaningful differences into a visual your audience can use.
Turn an idea into a complete, structured presentation. Define the audience and goal, guide the tone and length, and let SlidesPilot build the storyline, slide plan, content, and visual direction.
Convert PDF slides to editable PowerPoint online. Keep the original design and make text and slide elements editable. Free to use.
Turn Word documents into clear, structured, editable PowerPoint presentations with AI.
Start with your source information and create a Comparison, Venn, or Doughnut infographic with SlidesPilot. Refine the labels and highlight the differences that matter.

