

How to Turn a Financial Report into an Executive Presentation
Transform a detailed financial report into an executive presentation that makes performance, risks, and decisions easy to understand.
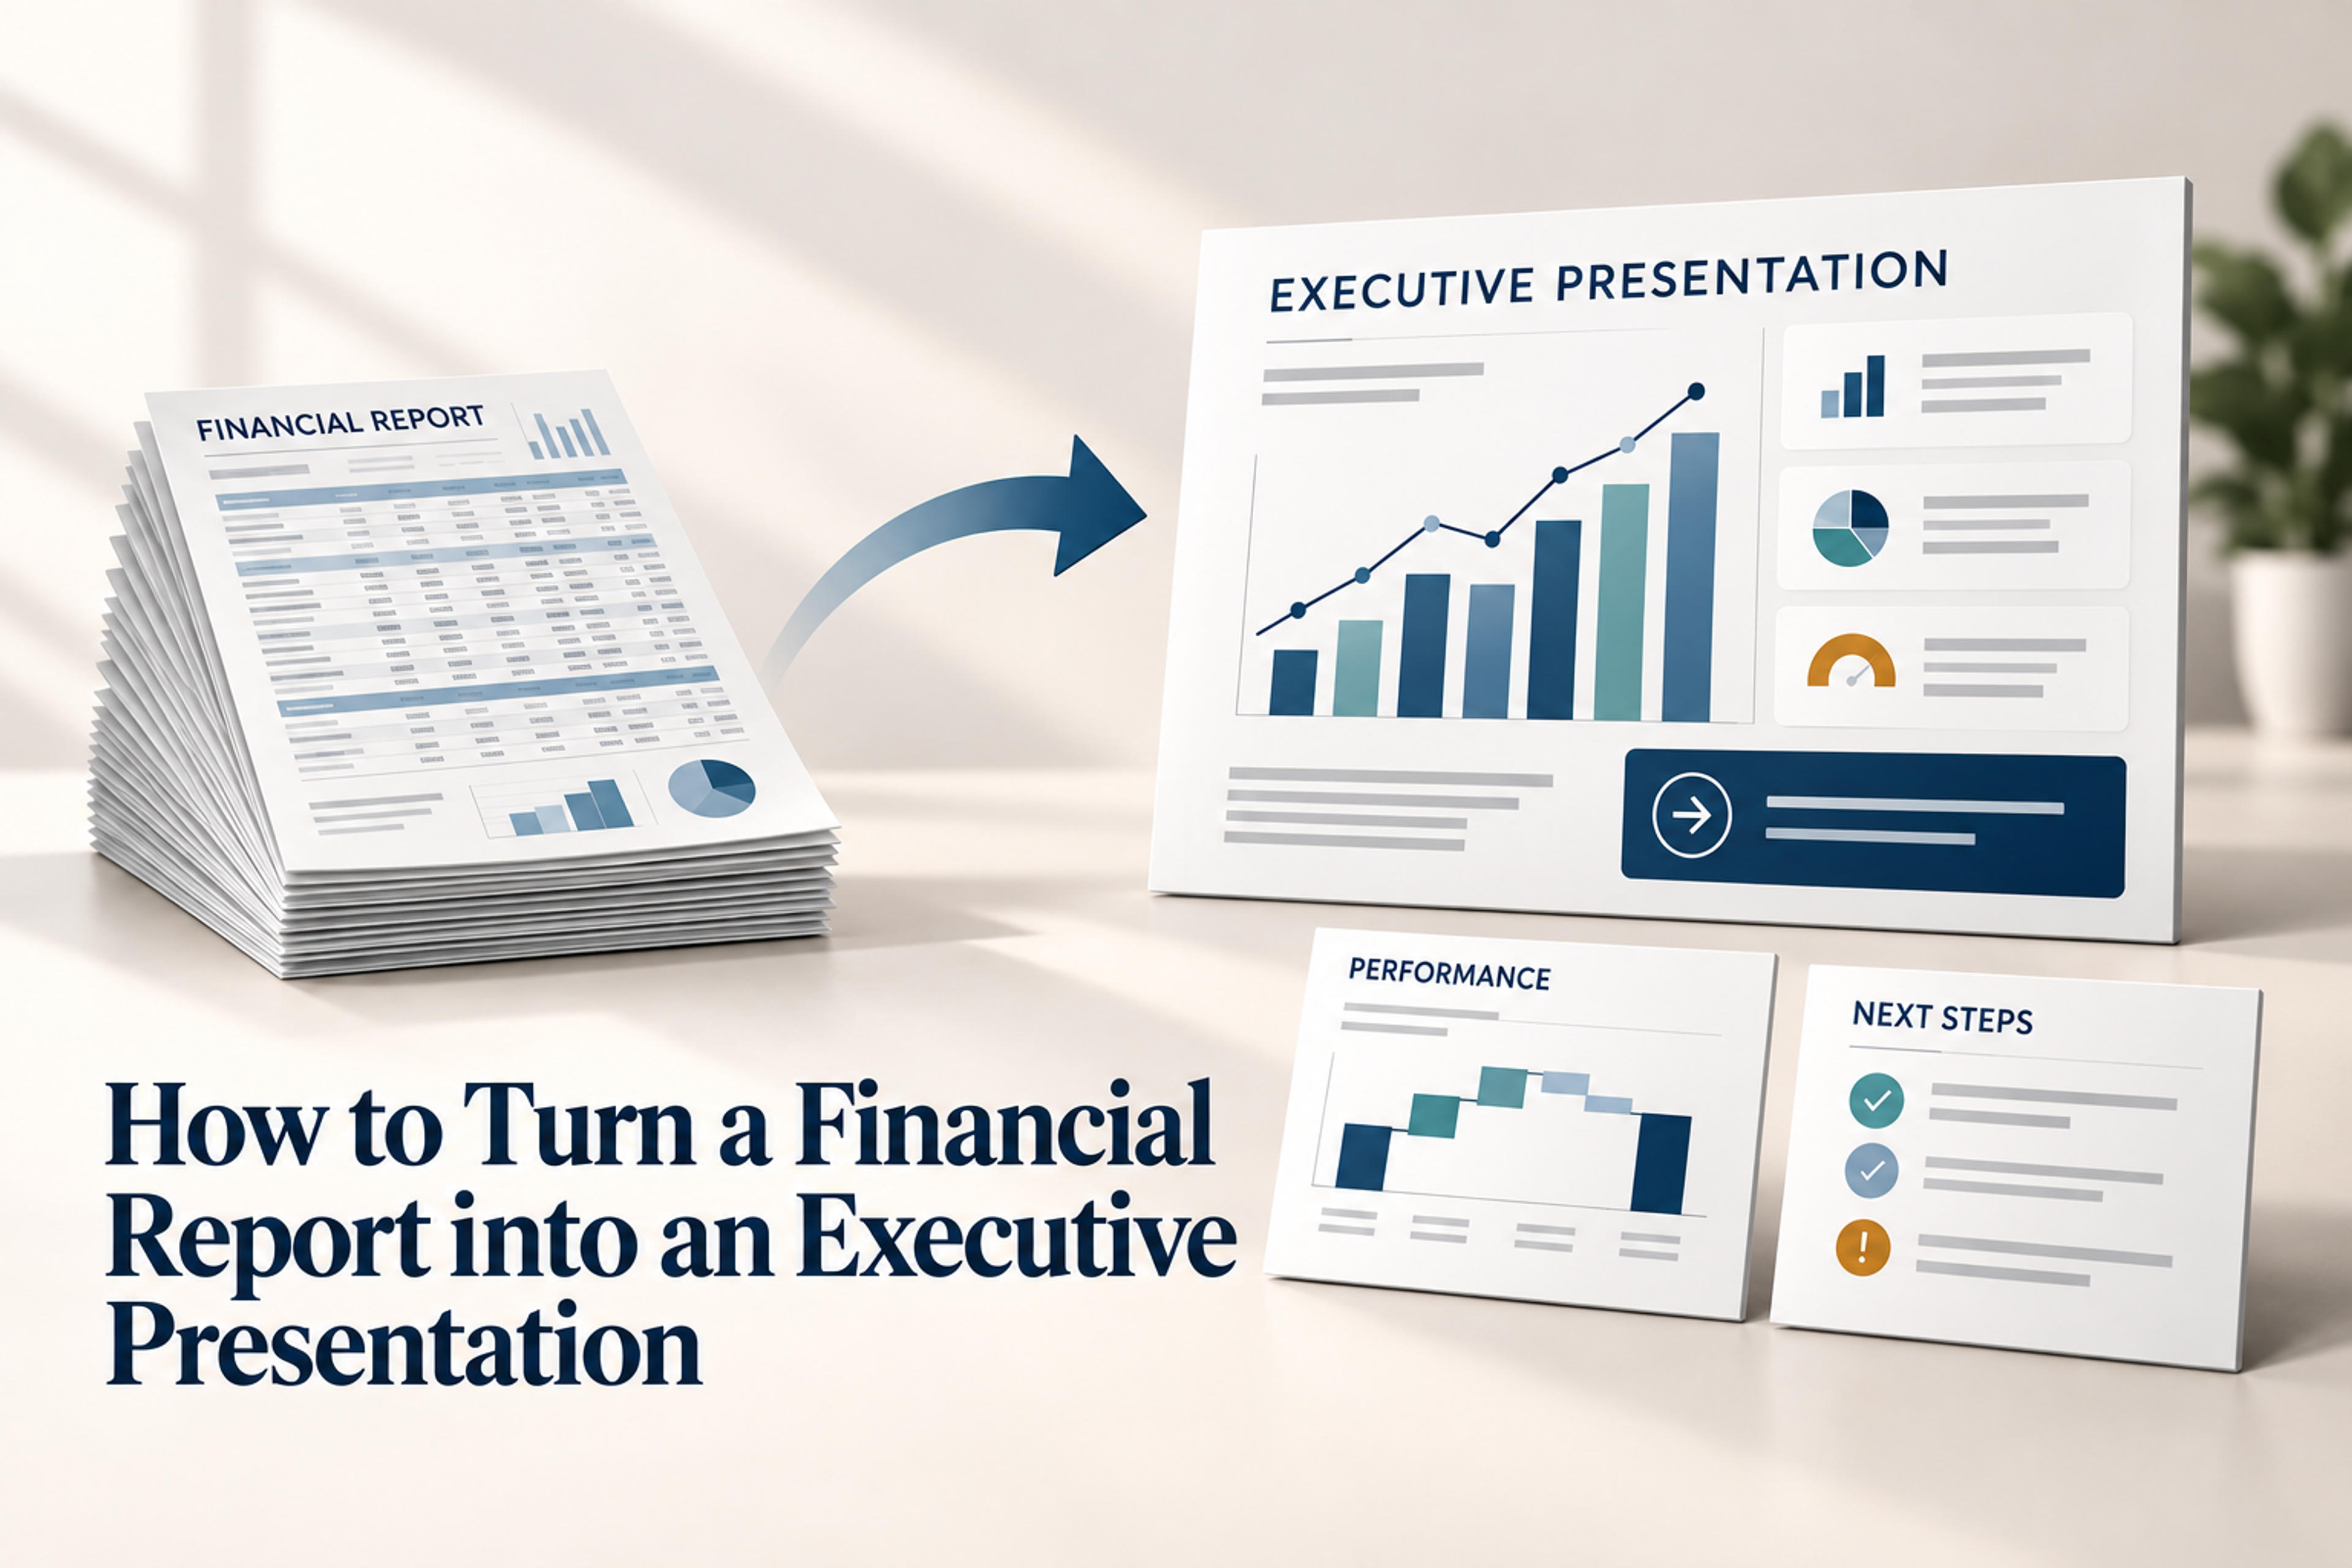
Transform a detailed financial report into an executive presentation that makes performance, risks, and decisions easy to understand.
A financial report is written to document performance. An executive presentation is built to help people understand what changed, why it changed, and what should happen next. Turning one into the other requires more than shortening paragraphs or copying tables into PowerPoint.
The most effective approach is to move from report section to executive question to slide message. Start with the decision the presentation must support, then select only the financial evidence that makes that decision easier.
The goal of many financial presentations is decision-making, not simply informing the audience. That distinction matters because it turns the source report into evidence for a management conversation rather than a complete slide-by-slide transcript.
Corporate Finance Institute suggests defining the conclusion first so every section builds toward the outcome you want. Before opening PowerPoint, complete this sentence:
Based on this report, leaders need to decide or understand ___.
The blank might relate to spending, resource allocation, a forecast, a performance gap, a risk, or the next operating priority. The exact decision changes the story. A board update may emphasize business health and forward-looking risks. A leadership review may focus on variance, ownership, and corrective action. A department meeting may need more operational detail.
DFIN Solutions suggests factoring in the audience's financial literacy when presenting to a board or leadership group. If some listeners are less comfortable with finance, use clearer labels, more visual context, and fewer unexplained acronyms; if the audience is highly financial, pair selected figures with a tighter narrative summary.
Next, write the central message in one sentence:
Performance is ___ because ___, which means we should ___.
This sentence becomes the presentation’s spine. It keeps the deck from becoming a tour through every page of the report and gives each slide a clear purpose.
Treat the report as source material, not as a finished outline. Translate each section into the question an executive audience is likely to ask.
| Financial report material | Executive question | Slide role | Useful visual form |
|---|---|---|---|
| Executive summary and management commentary | What is the headline? | State the overall performance and implication | One-sentence takeaway with a compact performance view |
| Income statement or profit and loss | What changed in performance? | Show the most important movement in revenue, costs, and profit | Trend, variance, or bridge chart |
| Cash flow statement | What happened to cash? | Explain cash generation, use, and pressure points | Cash movement diagram or simplified flow |
| Balance sheet | What is the financial position? | Show liquidity, leverage, working capital, or other decision-relevant conditions | Focused balance-sheet snapshot |
| Segment, product, or regional detail | Where is performance coming from? | Compare the areas driving the result | Ranked bars, heat map, or contribution chart |
| Budget, forecast, or outlook | What should we expect next? | Connect current performance to the forward view | Forecast line with key assumptions |
| Risks, controls, and assumptions | What could change the outlook? | Make uncertainty and response visible | Risk-impact-action table or priority matrix |
| Detailed schedules and supporting tables | What may we need in questions? | Preserve evidence without crowding the main story | Appendix or backup slides |
This map prevents a common failure: giving the report’s table of contents control over the presentation. Executives do not need every section to receive equal space. They need a coherent explanation of performance, the drivers behind it, the implications, and the action required.
A strong executive presentation can usually follow the logic below. Adapt the sequence to the report and the meeting, but keep the movement from headline to evidence to action.
Identify the reporting period, business area, and purpose of the meeting. Add the main takeaway in plain language. A title such as Performance review: growth is ahead of plan, but margin pressure needs action gives the audience a starting point. A title such as Financial report does not.
Show the small set of indicators that establishes the current position. Depending on the report, this might include revenue, profitability, cash, operating costs, or another measure that directly supports the meeting’s purpose. Use short labels and make the comparison clear: actual versus plan, current period versus prior period, or current outlook versus earlier outlook.
Explain why performance moved. Separate the result from its causes. A bridge or waterfall can show how starting performance became the current result through volume, price, mix, cost, timing, or other approved categories from the report. The goal is not to display every variance; it is to show the drivers that change the interpretation or action.
Give cash and balance-sheet information a visible place when it affects the decision. A profitable result does not answer every question about liquidity, working capital, capital needs, or financial resilience. Select the position indicators that leaders need for the specific discussion and explain the movement in simple terms.
Show where the result is being created or absorbed. Compare segments, products, regions, channels, or cost categories only when the comparison helps explain performance or assign action. Use ranking and contribution visuals to make concentration, growth, or pressure points easy to see.
Connect the reported result to the forward view. State the assumptions that matter, the risks that could change the outlook, and the actions already planned or under consideration. Keep the risk discussion tied to impact and response rather than presenting a long register.
Make the requested decision explicit. Present the recommended action, the evidence supporting it, the trade-off leaders should understand, and the consequence of waiting. If no decision is required, state the next management action instead.
Close with owners, timing, and the immediate follow-up. Put detailed schedules, definitions, reconciliation tables, and secondary analyses in backup slides so they remain available during questions without weakening the main story.
Every slide should answer one question. When the audience can follow the sequence from what happened to why it happened to what we should do, the financial report becomes a useful management conversation instead of a data handoff.
A report may contain more valid numbers than an executive presentation can use. Apply these tests before adding a figure:
If the answer is no to all five, move the number to the appendix or leave it in the source report. A smaller set of connected measures is more persuasive than a crowded dashboard.
Upload it to SlidesPilot and turn your performance, implications, risks and decisions into a structured, editable PowerPoint.
Turn My Financial Report Into SlidesFinancial reports often rely on tables because tables preserve detail. Presentations need visuals that make comparison and direction visible.
DFIN Solutions suggests using visual aids such as tables, trend lines, and variance charts to highlight the main takeaways and top-line trends. Use the visual form that matches the question:
Write the takeaway as the slide title. Operating costs are absorbing the benefit of higher revenue tells the audience how to read the visual. Operating costs only names the topic.
Keep the source detail available, but reduce visual competition on the main slide. Show the comparison, label the units, identify the period, and annotate the result that matters. Avoid placing a full spreadsheet beside a paragraph that explains what the audience should have noticed.
Imagine a report showing that revenue is ahead of plan in one business area, while margin has narrowed and collections are taking longer. A report-style slide might list the income statement, working-capital schedule, segment table, and management commentary in separate blocks. The facts are all present, but the relationship between them is hard to see.
An executive version could use one clear title: Growth is ahead of plan, but margin and collections need action. Below it, a compact performance visual shows the result against plan. A driver chart explains the margin movement. A cash callout shows the collection pressure. The final line states the recommended action and owner.
The executive version has not removed the underlying evidence. It has organized the evidence around the decision. Leaders can see what is working, what is weakening the result, and where a response is needed.
When the financial report is a long PDF or Word document, separate extraction from presentation design. First, identify the reporting period, headline performance, main drivers, cash and financial-position implications, outlook, risks, and decisions. Then turn those findings into slide messages.
SlidesPilot can turn a PDF or Word document into a structured, editable presentation draft. You can choose a presentation style, adjust the length and tone, and refine the resulting slides in the editor. For an executive financial presentation, use the draft as a starting point, then rewrite slide titles as conclusions, reduce secondary detail, and make the decision or next step visible.
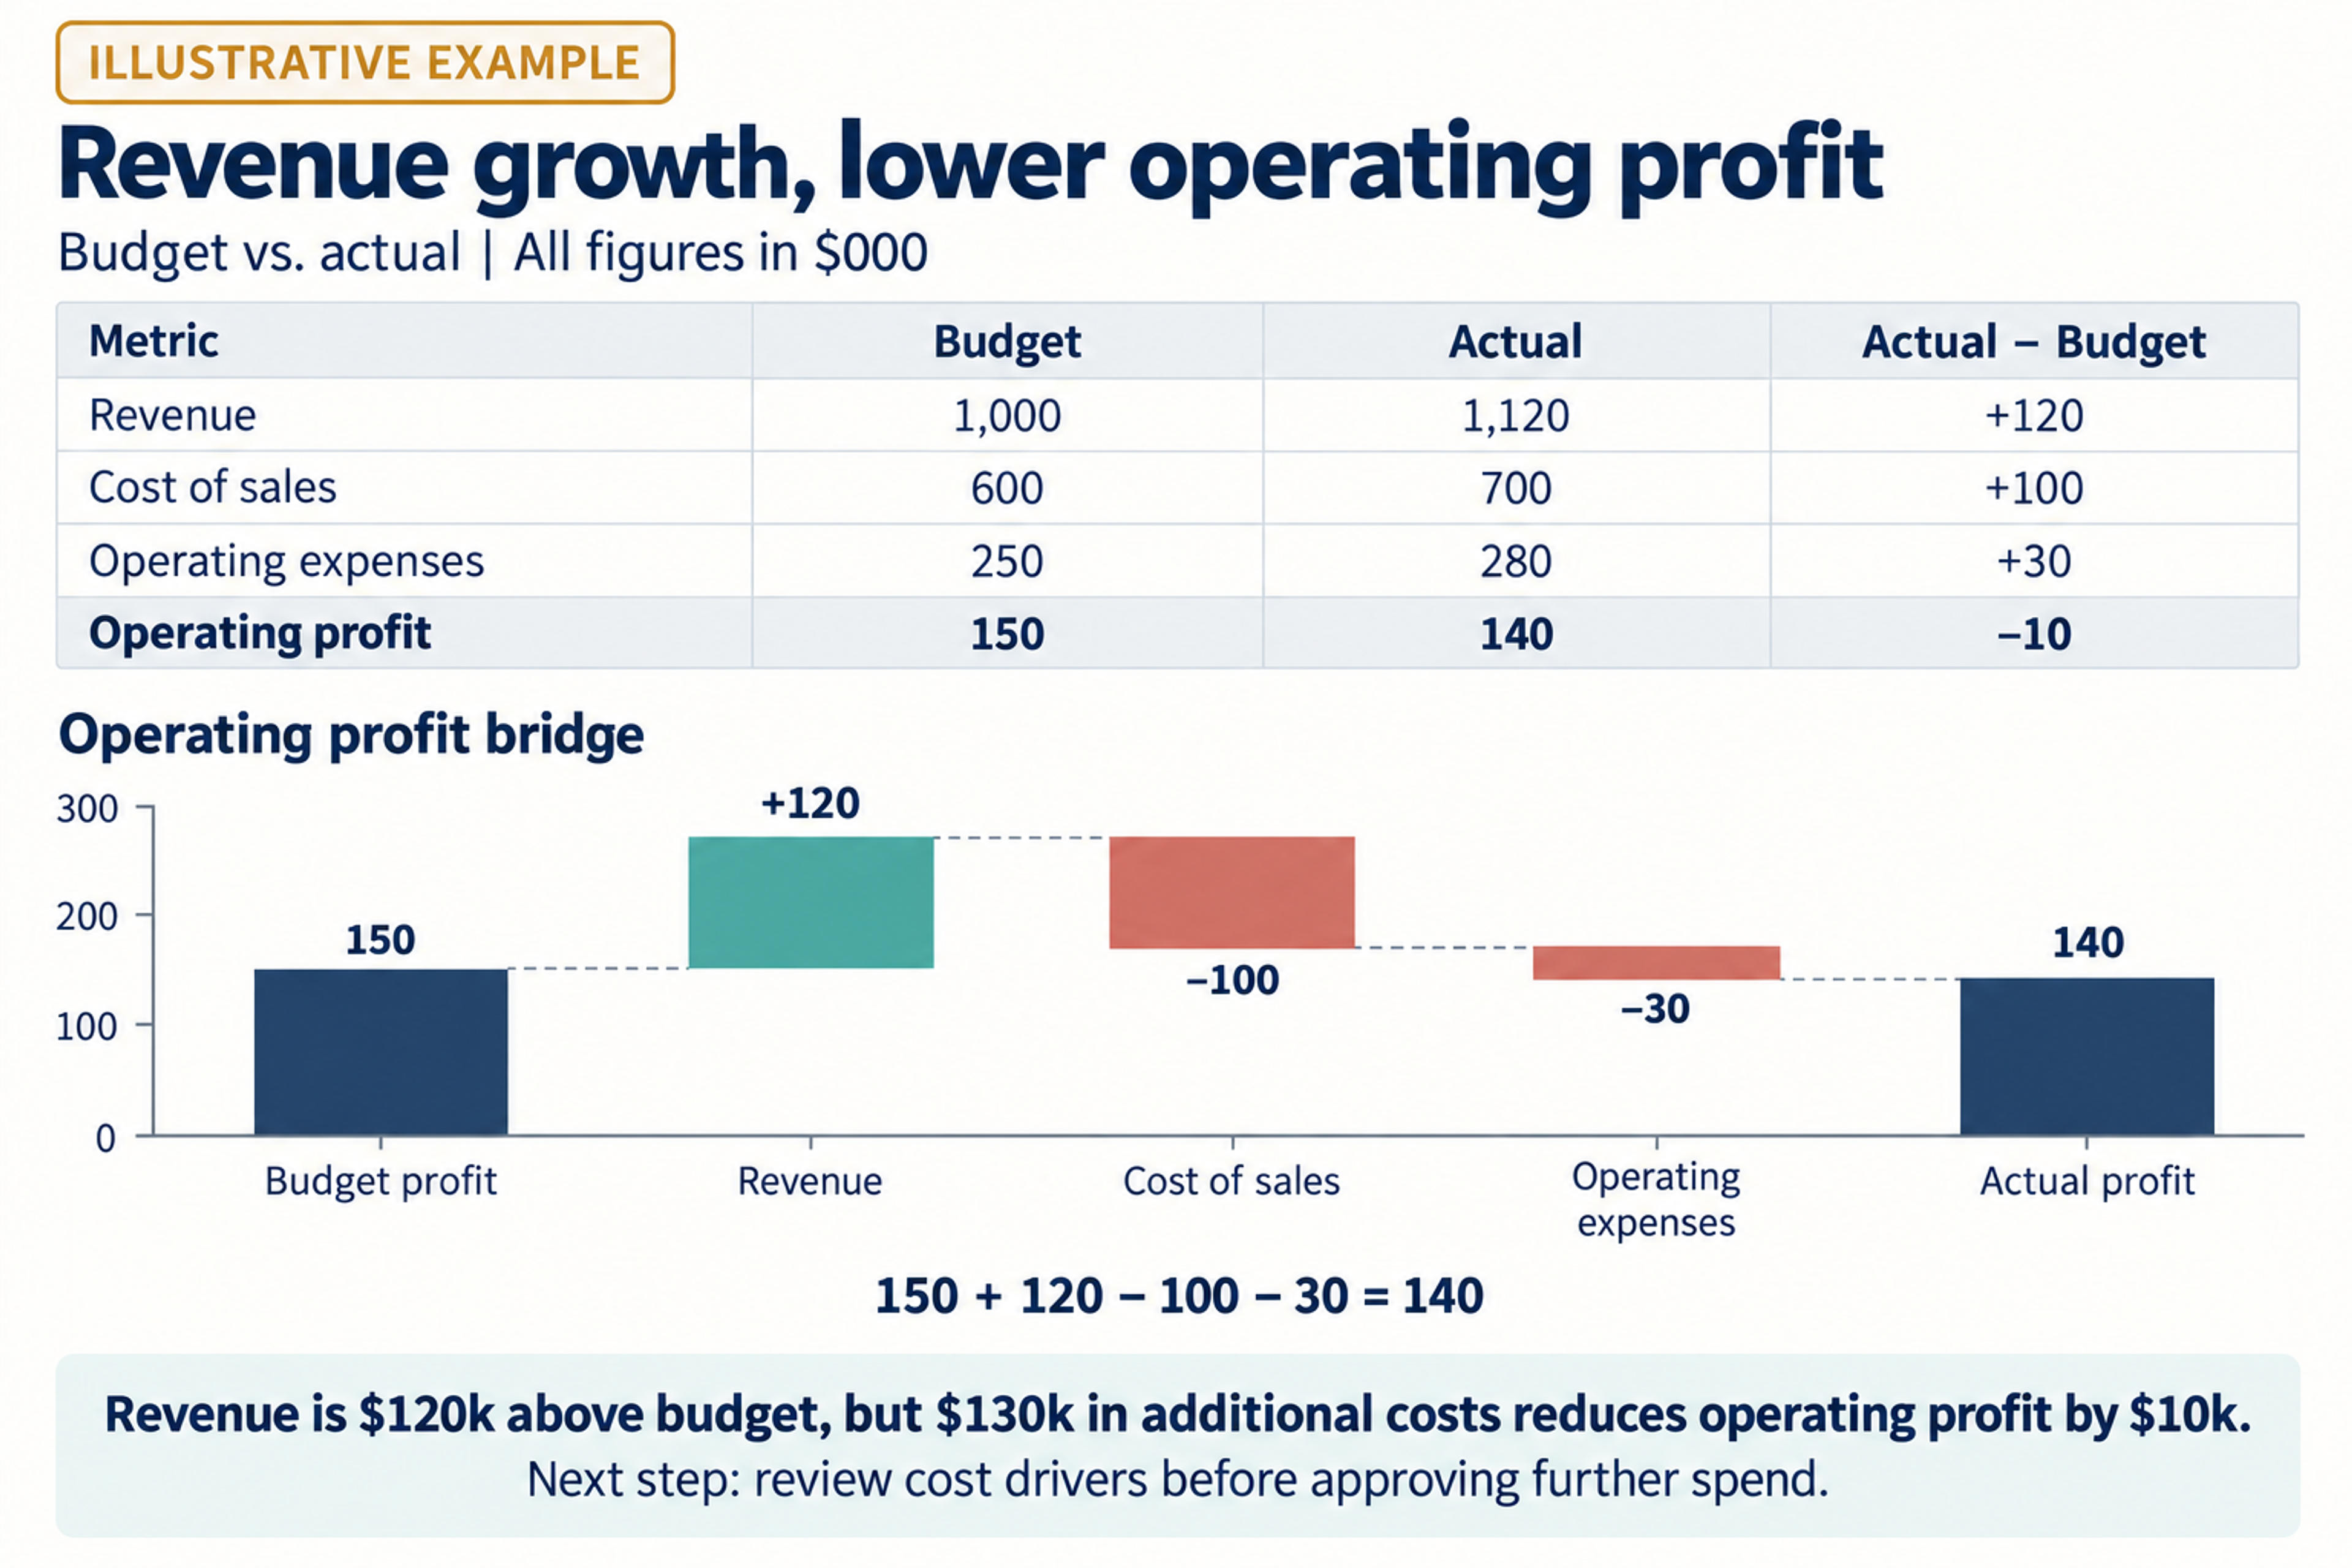
A financial presentation should not force the audience to infer the recommendation from a collection of charts. Give the recommendation its own space and connect it to the evidence:
This structure also helps separate analysis from action. A chart may show a variance, but the recommendation explains how management should respond to it. When options exist, compare them using the criteria that matter for the decision, such as impact, timing, resources, or risk.
Corporate Finance Institute suggests making the call to action specific about what needs to happen, why it matters, when it should happen, and who is responsible. Use that test on the recommendation slide before presenting it to executives.
Before presenting, review the deck as both a financial analyst and an executive audience member. Confirm that:
Start with the executive takeaway, performance snapshot, main drivers, cash or financial position, business mix, outlook and risks, recommendation, and next steps. Add or remove sections based on the decision and audience. Keep detailed schedules in an appendix.
Let the meeting purpose and time limit determine the length. Give the headline, evidence, implication, and action enough space to stay clear. If the deck keeps expanding, narrow the central question before adding more slides.
Keep details that change the interpretation, support the recommendation, explain a material movement, or answer a likely executive question. Move repeated values, secondary analyses, and full reconciliations to backup slides. Simplification should improve the path through the evidence, not remove the evidence needed to understand the decision.
Lead with the business implication, then explain the financial evidence in plain language. Define specialized terms only when they are necessary. Use titles, annotations, and comparisons to show what the audience should notice instead of assuming they will interpret a dense statement unaided.
Yes. SlidesPilot can analyze a source document, identify key ideas, organize them into a presentation, and produce editable slides that you can review and refine. Give the draft a clear audience and decision focus, then edit the slide messages so the final deck reflects the business conversation you need to lead.
Turning a financial report into an executive presentation means changing the organizing principle from documentation to decision-making. Start with the action or understanding the meeting requires, map report sections to executive questions, select evidence that explains the result, and make the recommendation visible.
Then build the deck so every slide moves the audience from performance to drivers to implications to next steps. For a faster starting point, create an editable presentation from your source report in SlidesPilot and shape it around the decision leaders need to make.
Turn reports, papers, and documents into clear, structured, editable PowerPoint presentations with AI.
Paste text, add a YouTube or webpage link, or upload a document to create a beautiful, structured summary connected to the source.
Transform plain PowerPoint presentations into professional designs using AI
Turn an idea into a complete, structured presentation. Define the audience and goal, guide the tone and length, and let SlidesPilot build the storyline, slide plan, content, and visual direction.
Turn your financial report into an editable slide draft and refine the story leaders need to act on.


