

Turn Metrics into Executive Story
SlidesPilot organizes quarterly performance around what changed, why it changed, and what matters next. The deck helps leaders move from raw metrics to business decisions.
Transform draft reports into executive-ready PowerPoint presentations using Nanobanana Pro
Drag & drop your file here or
Preview how SlidesPilot can turn your source material into a clearer deck before you export or share the result.
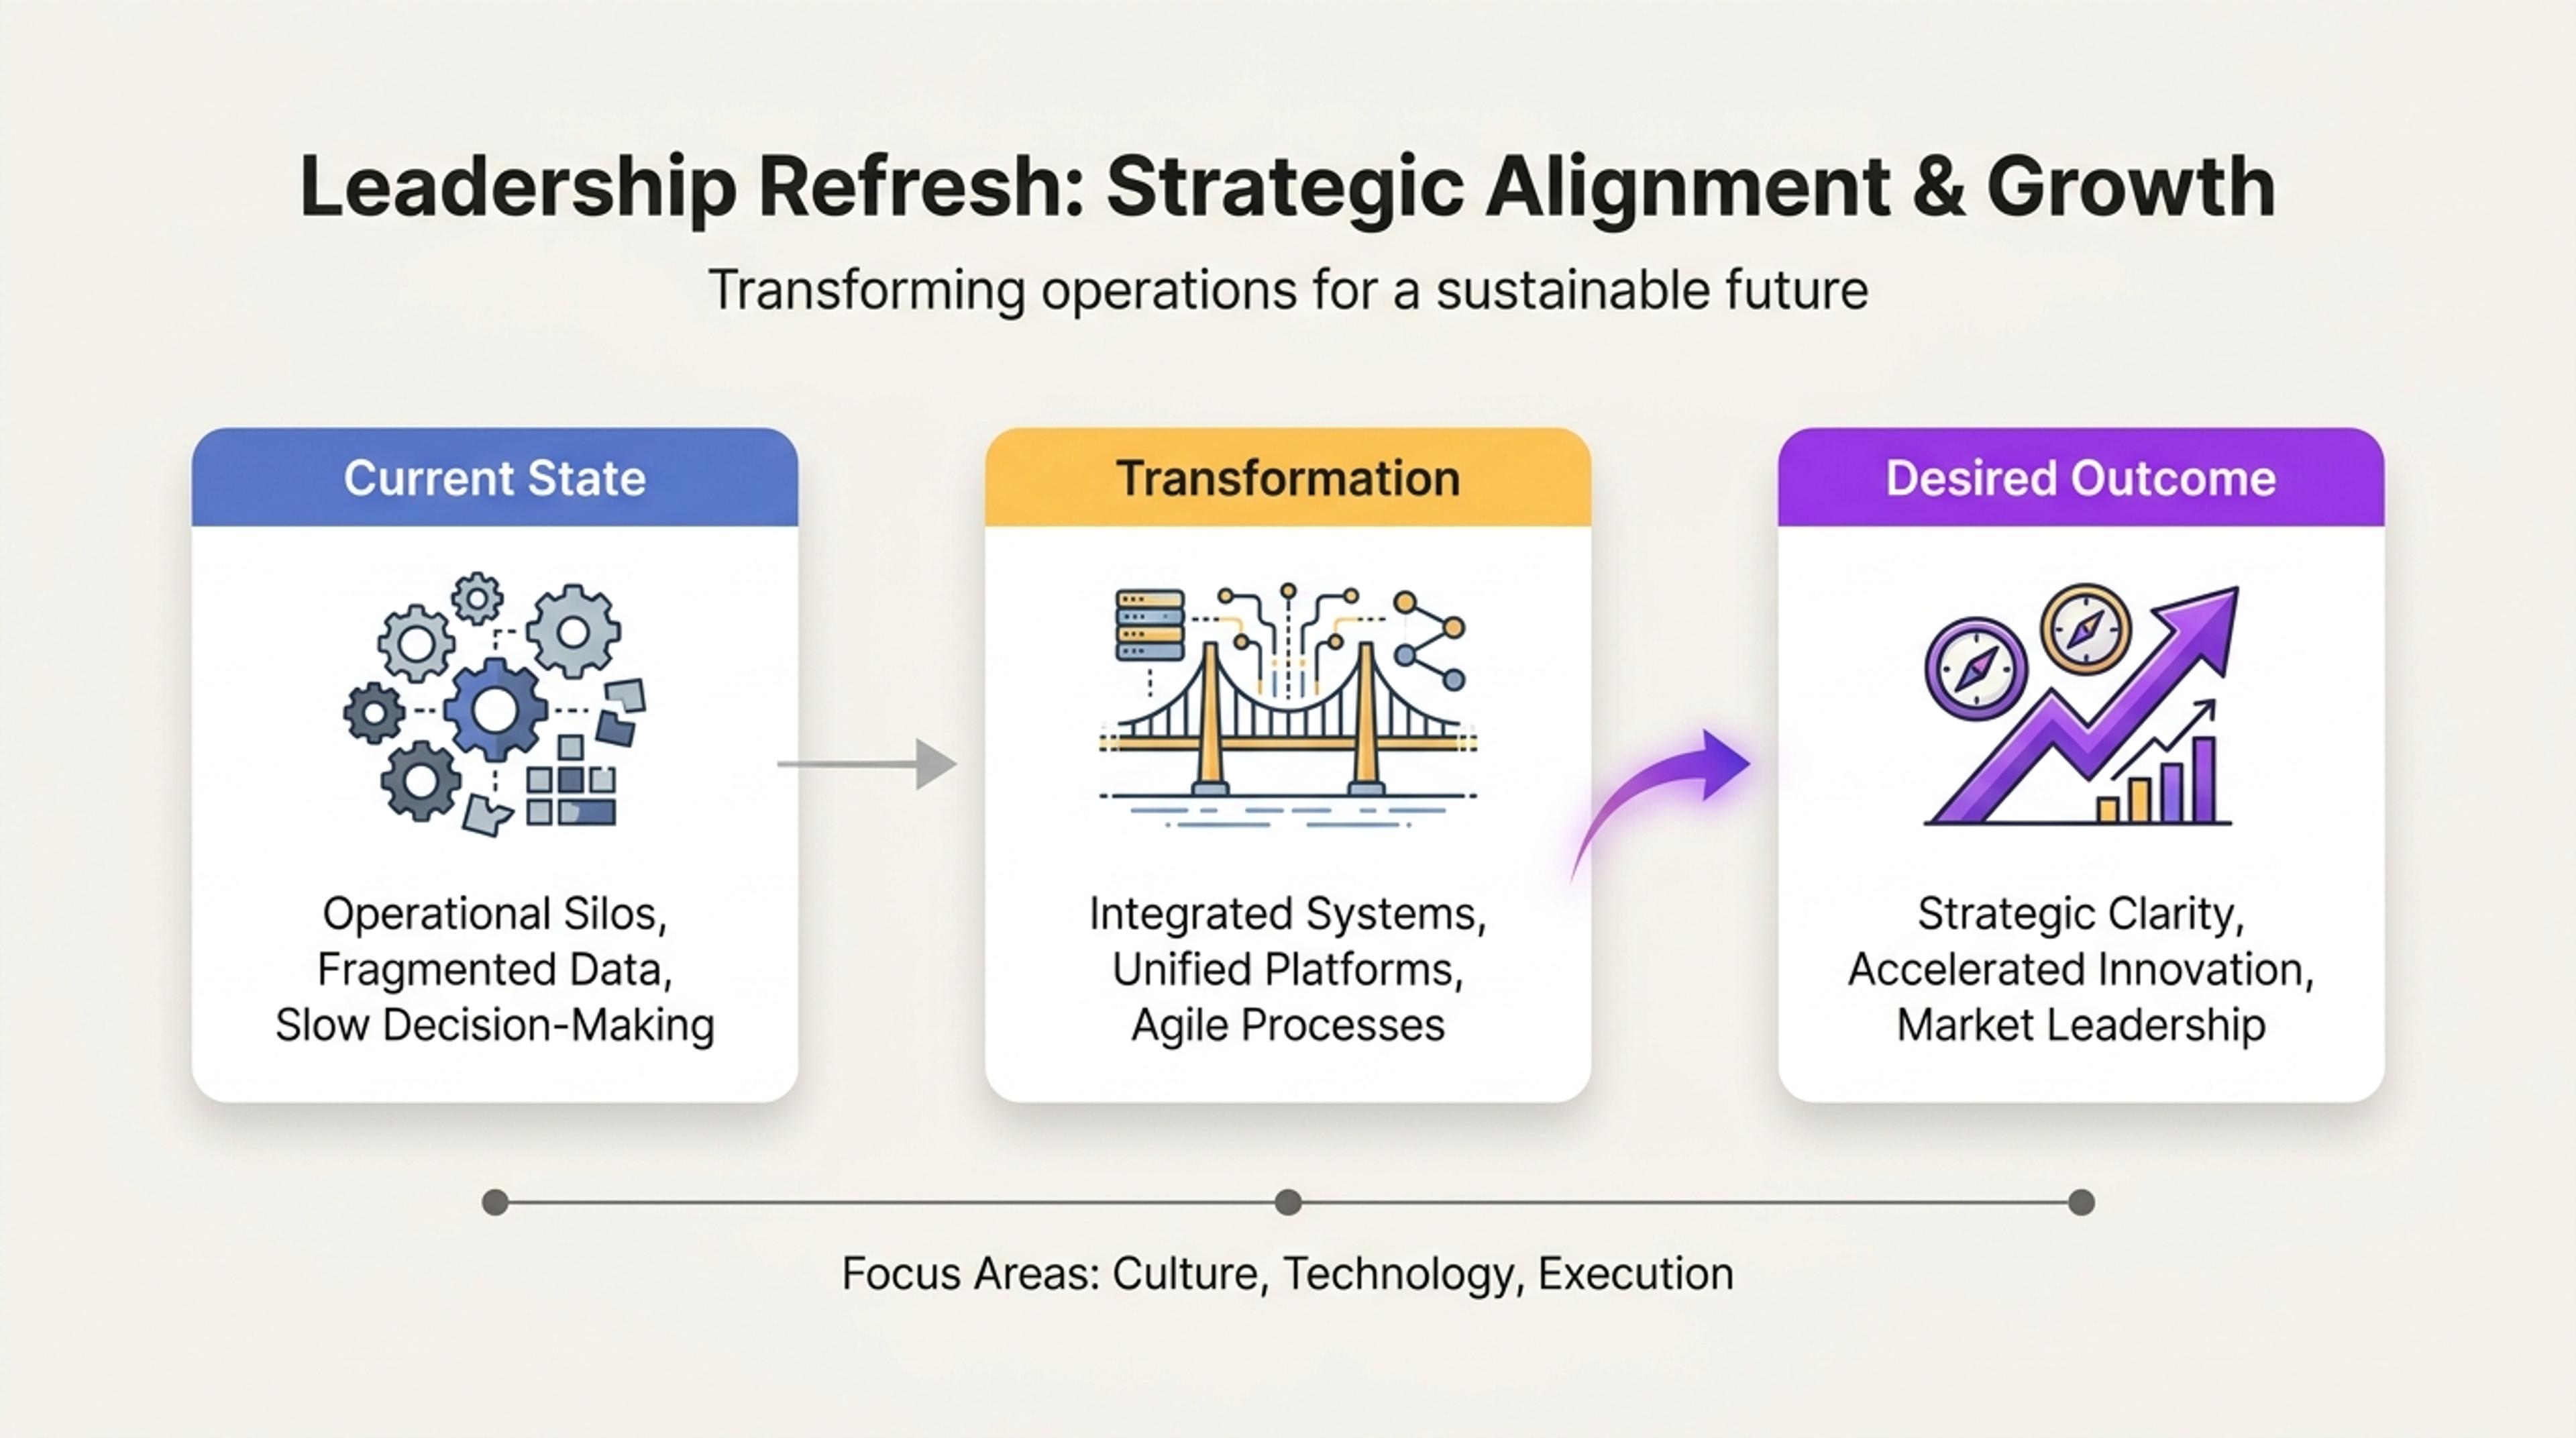
Turn rough presentation drafts into a leadership-ready refresh with clearer hierarchy and tighter visuals.
Professionalize quarterly business reports into executive-ready decks with KPI narrative, performance drivers, insights, risks, priorities, and next-quarter actions.
SlidesPilot organizes quarterly performance around what changed, why it changed, and what matters next. The deck helps leaders move from raw metrics to business decisions.
Wins, misses, customer signals, revenue movement, risks, initiatives, and next-quarter priorities can become clear slide sections. This makes reporting more useful for leadership review.
The output supports executive meetings, board updates, department reviews, and client QBRs. Teams can tune the language and detail level for internal or customer-facing audiences.
Upload the quarterly business report, QBR deck, KPI notes, charts, financial summary, customer commentary, or executive update. Add the audience, quarter, and review goal.
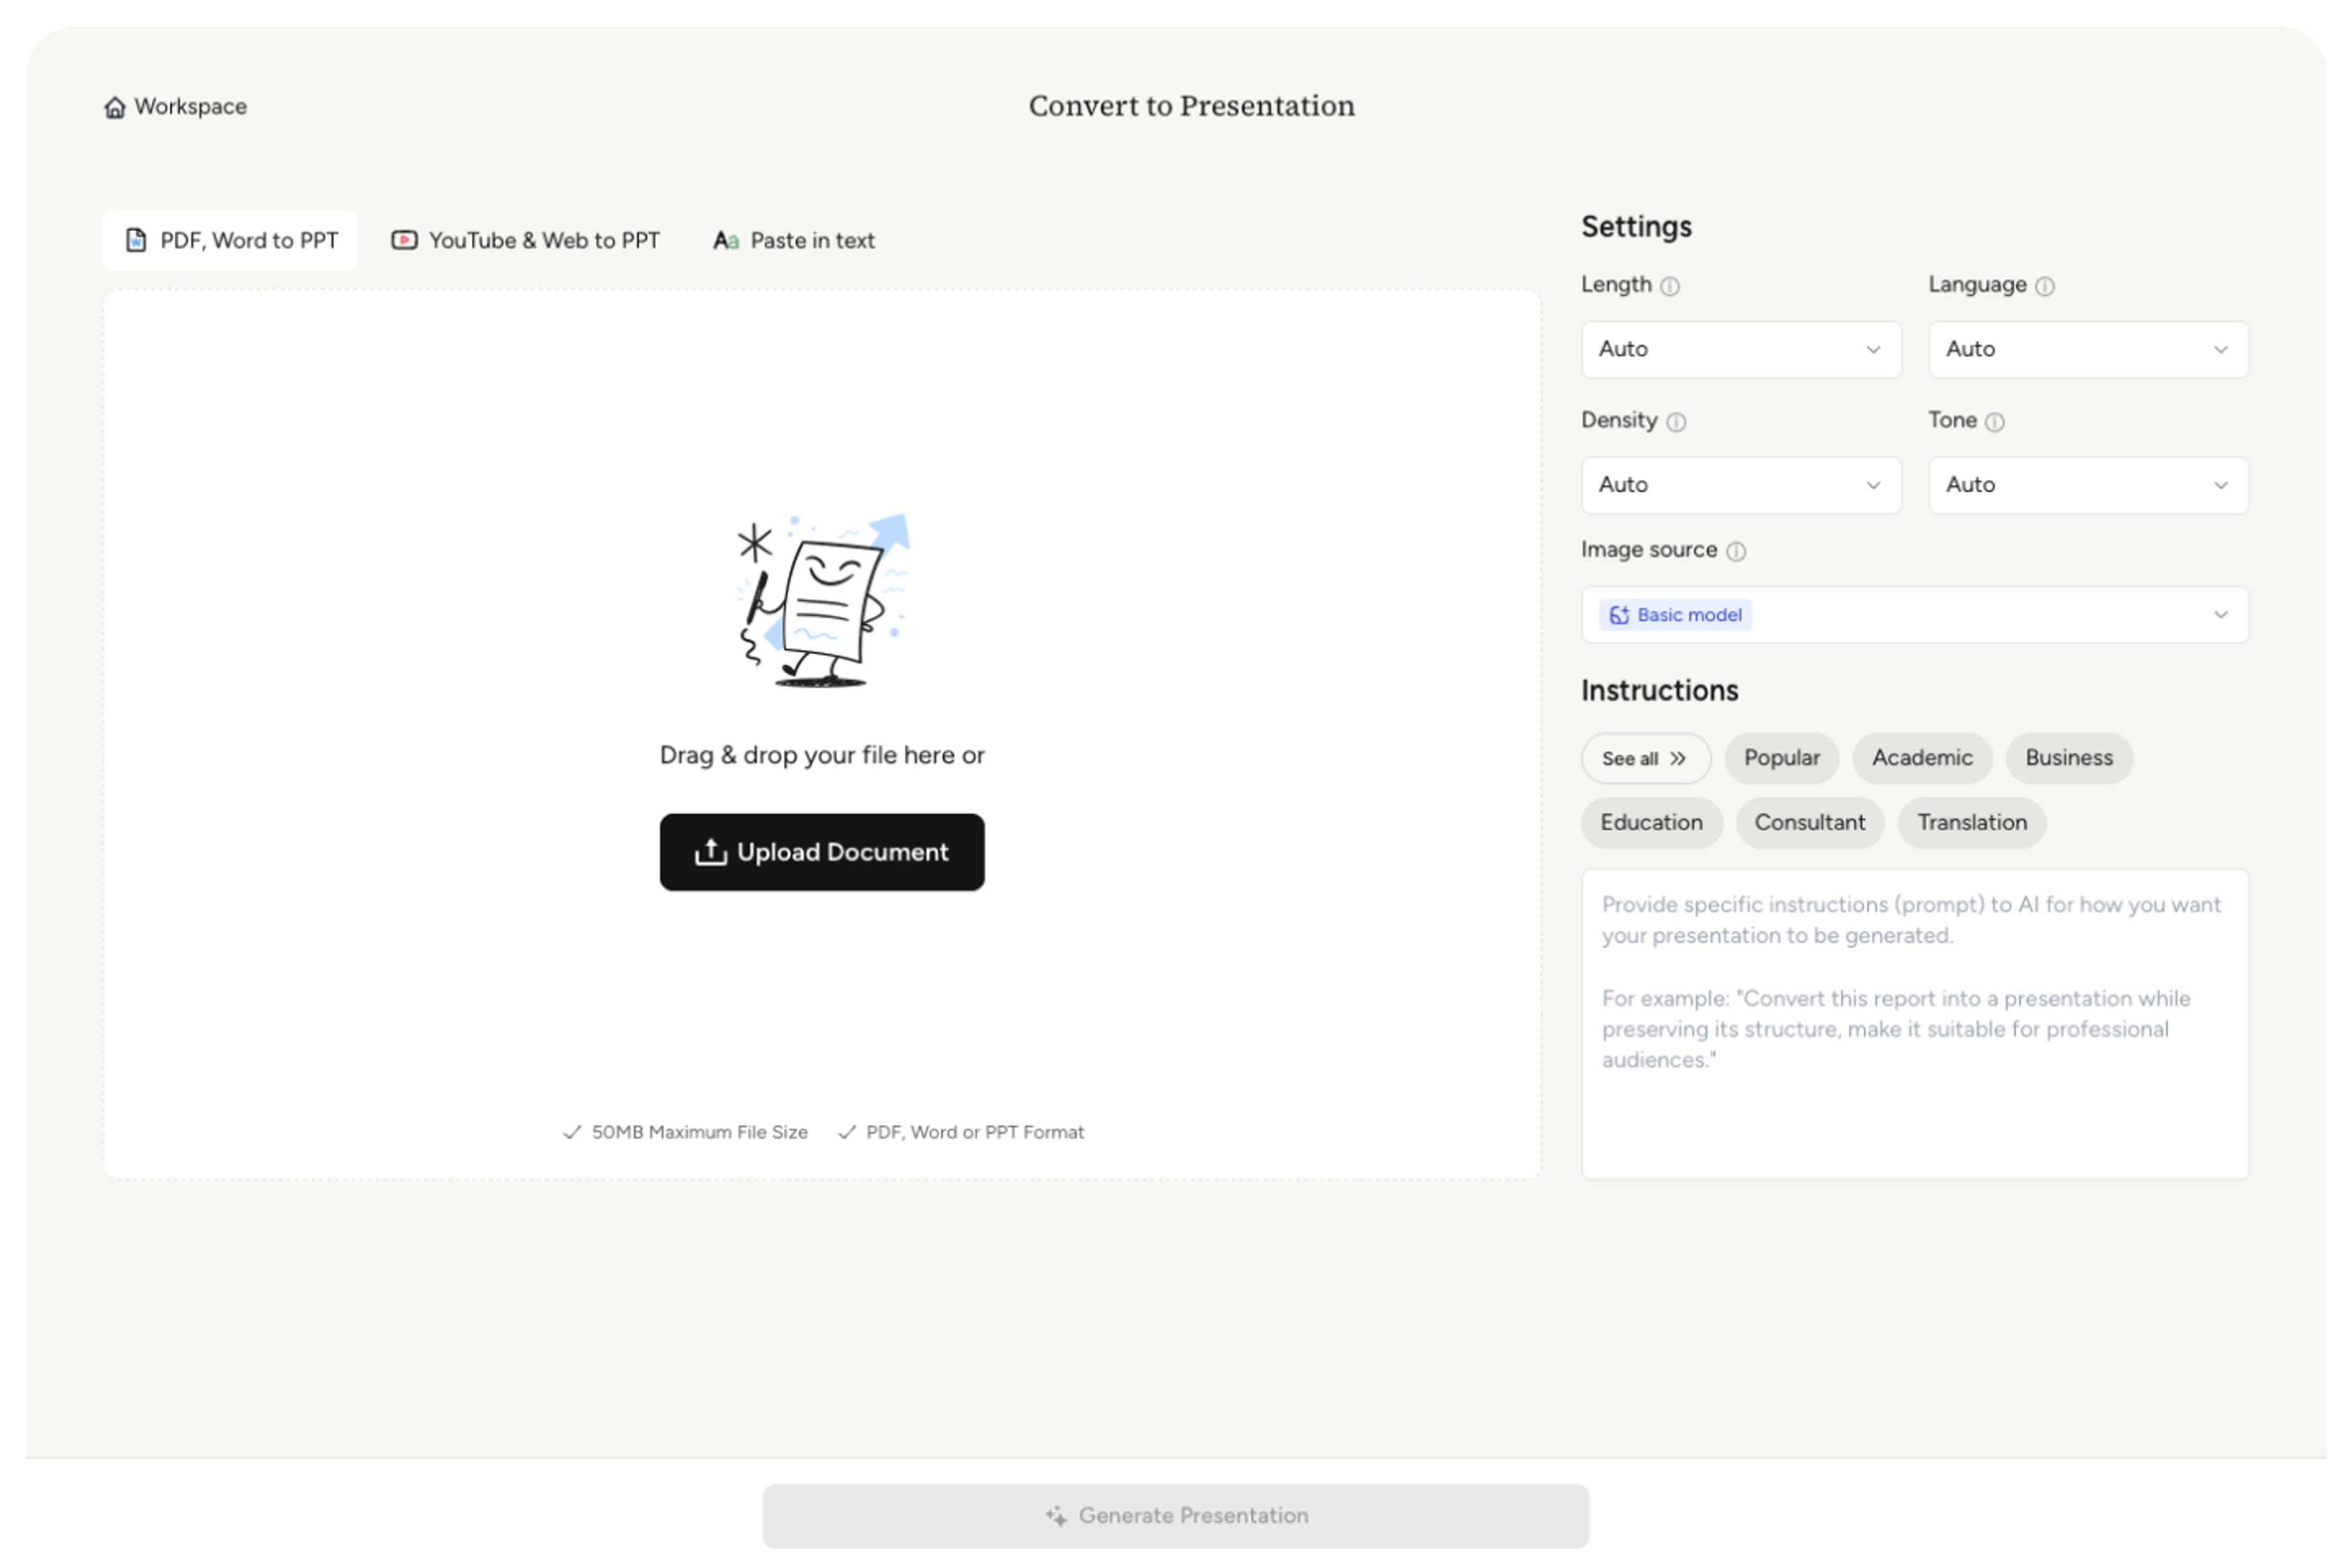
SlidesPilot identifies KPIs, performance movement, drivers, wins, misses, risks, customer signals, initiatives, and next-quarter priorities. This turns reporting material into an executive narrative.
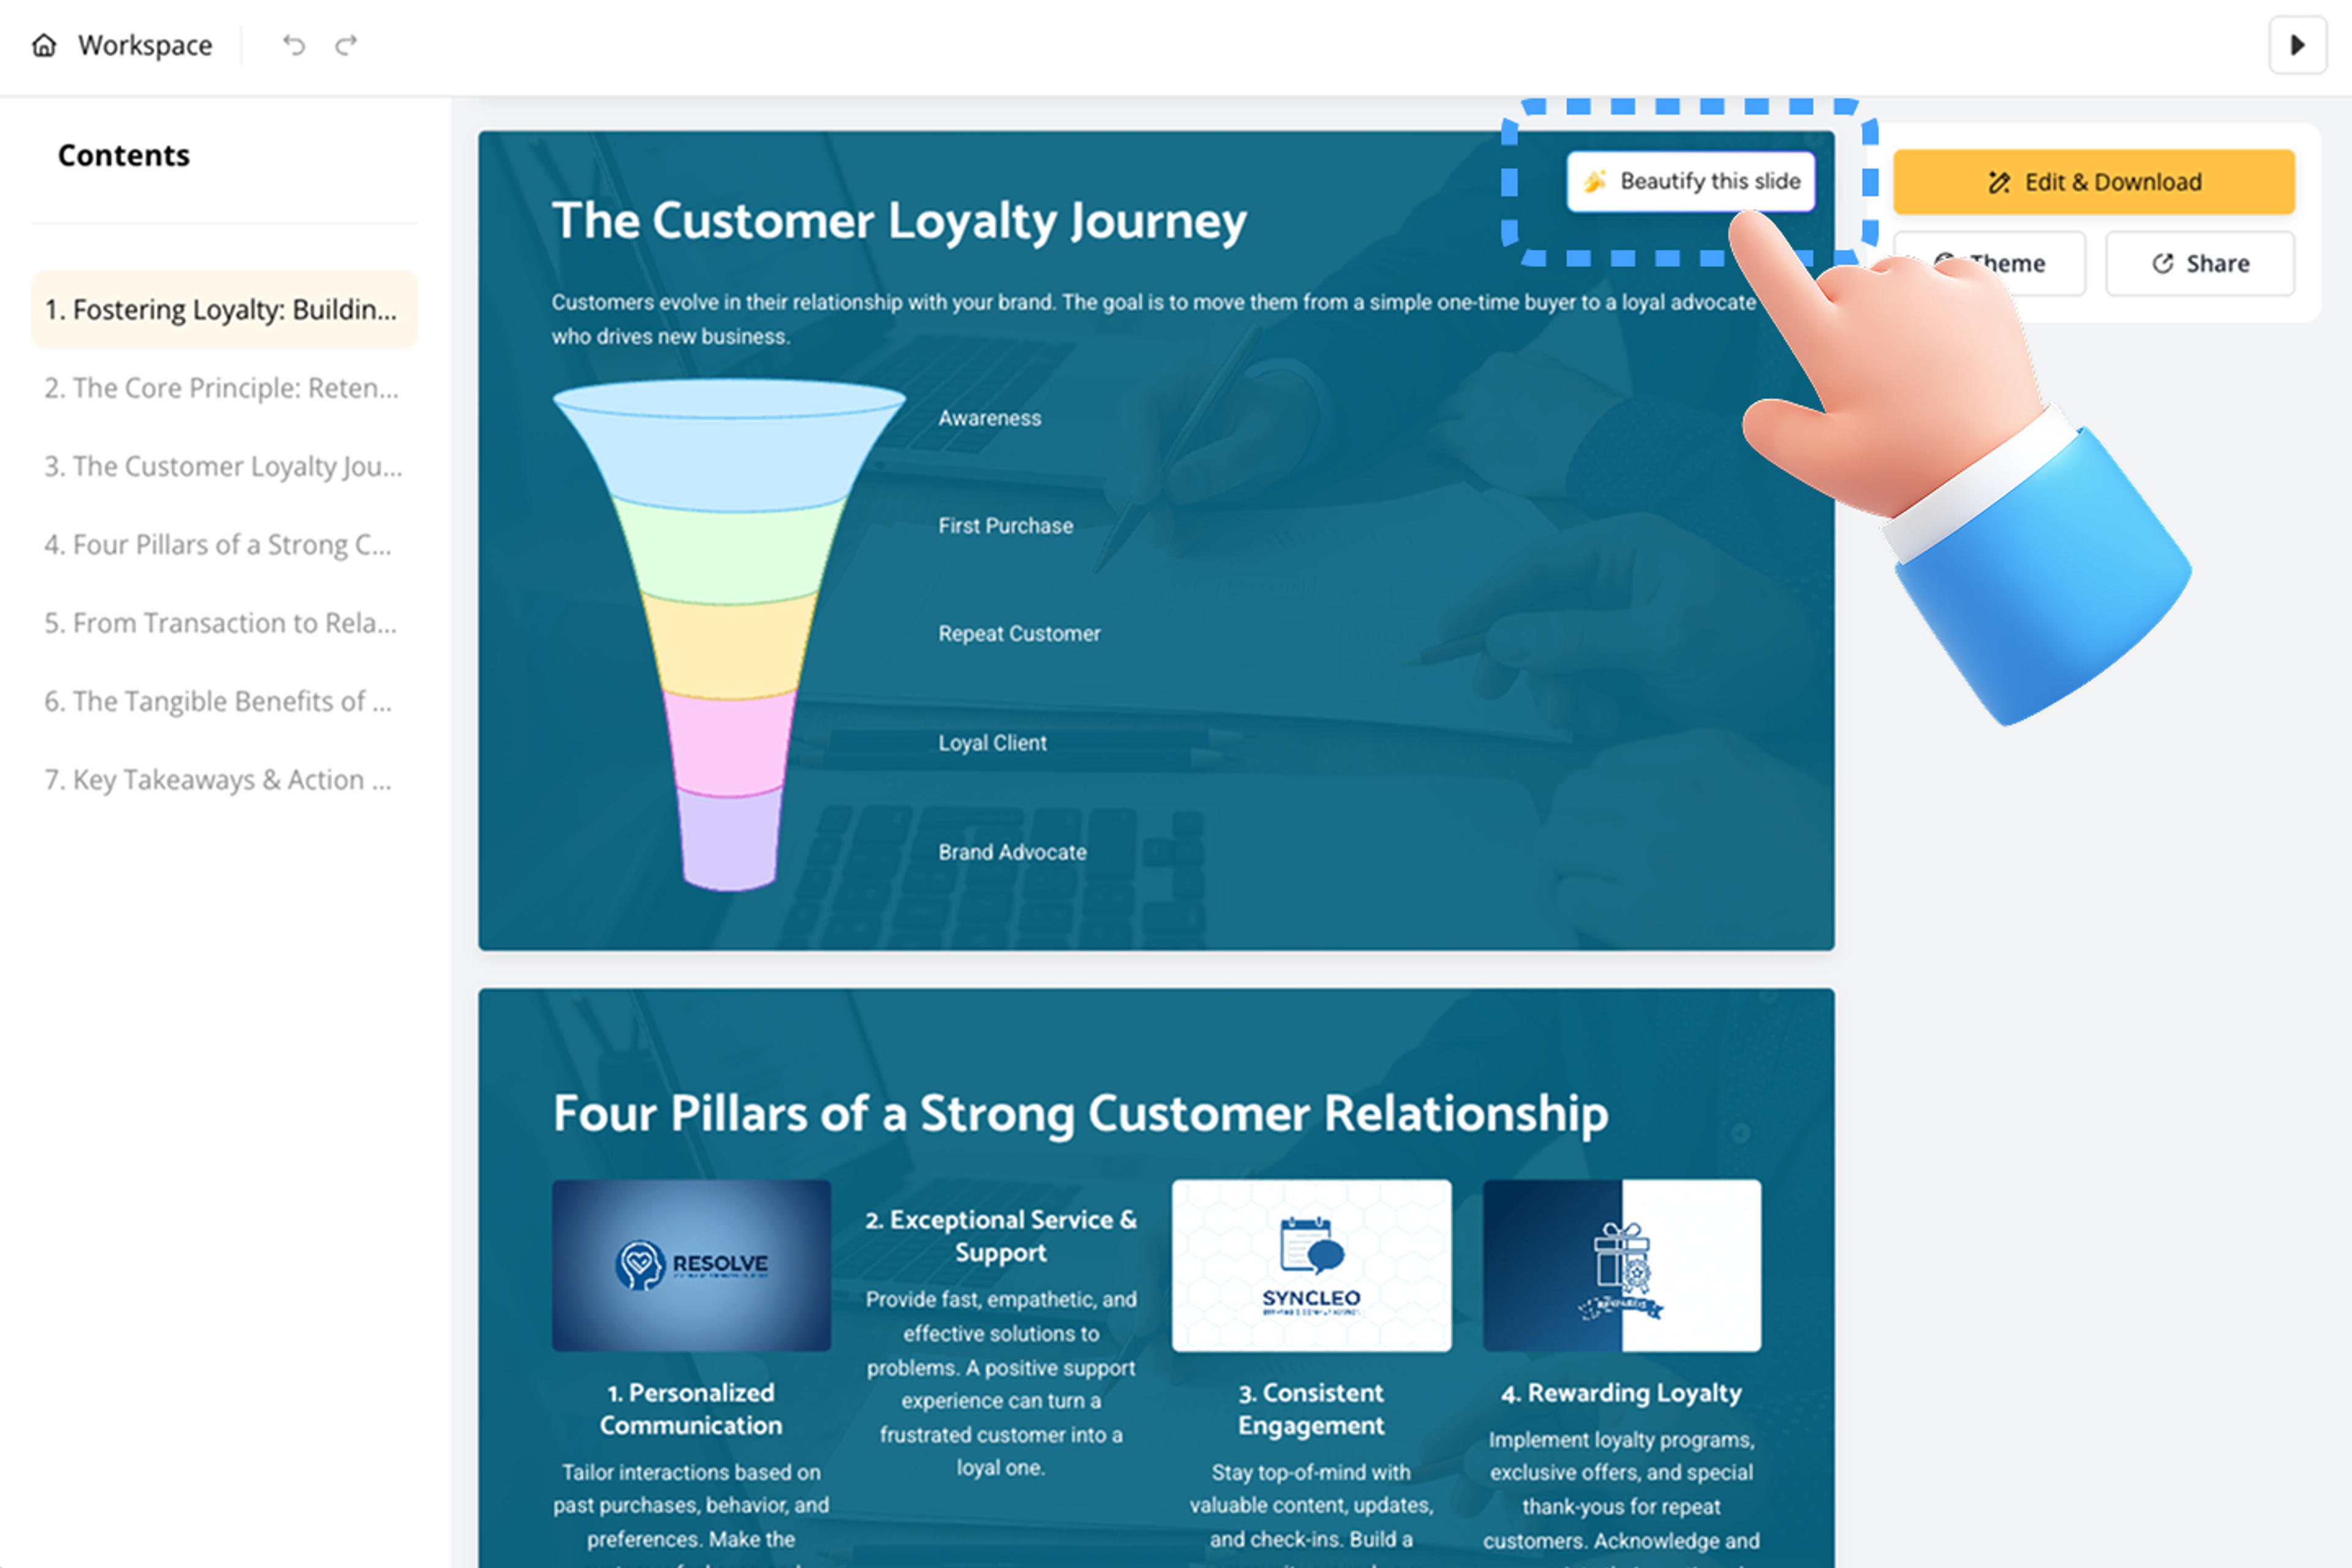
Choose the professionalization focus: KPI flow, chart clarity, executive summary, priority slides, risk framing, or next-quarter plan. A sales QBR can become slides on performance, pipeline, forecast, risks, and actions.
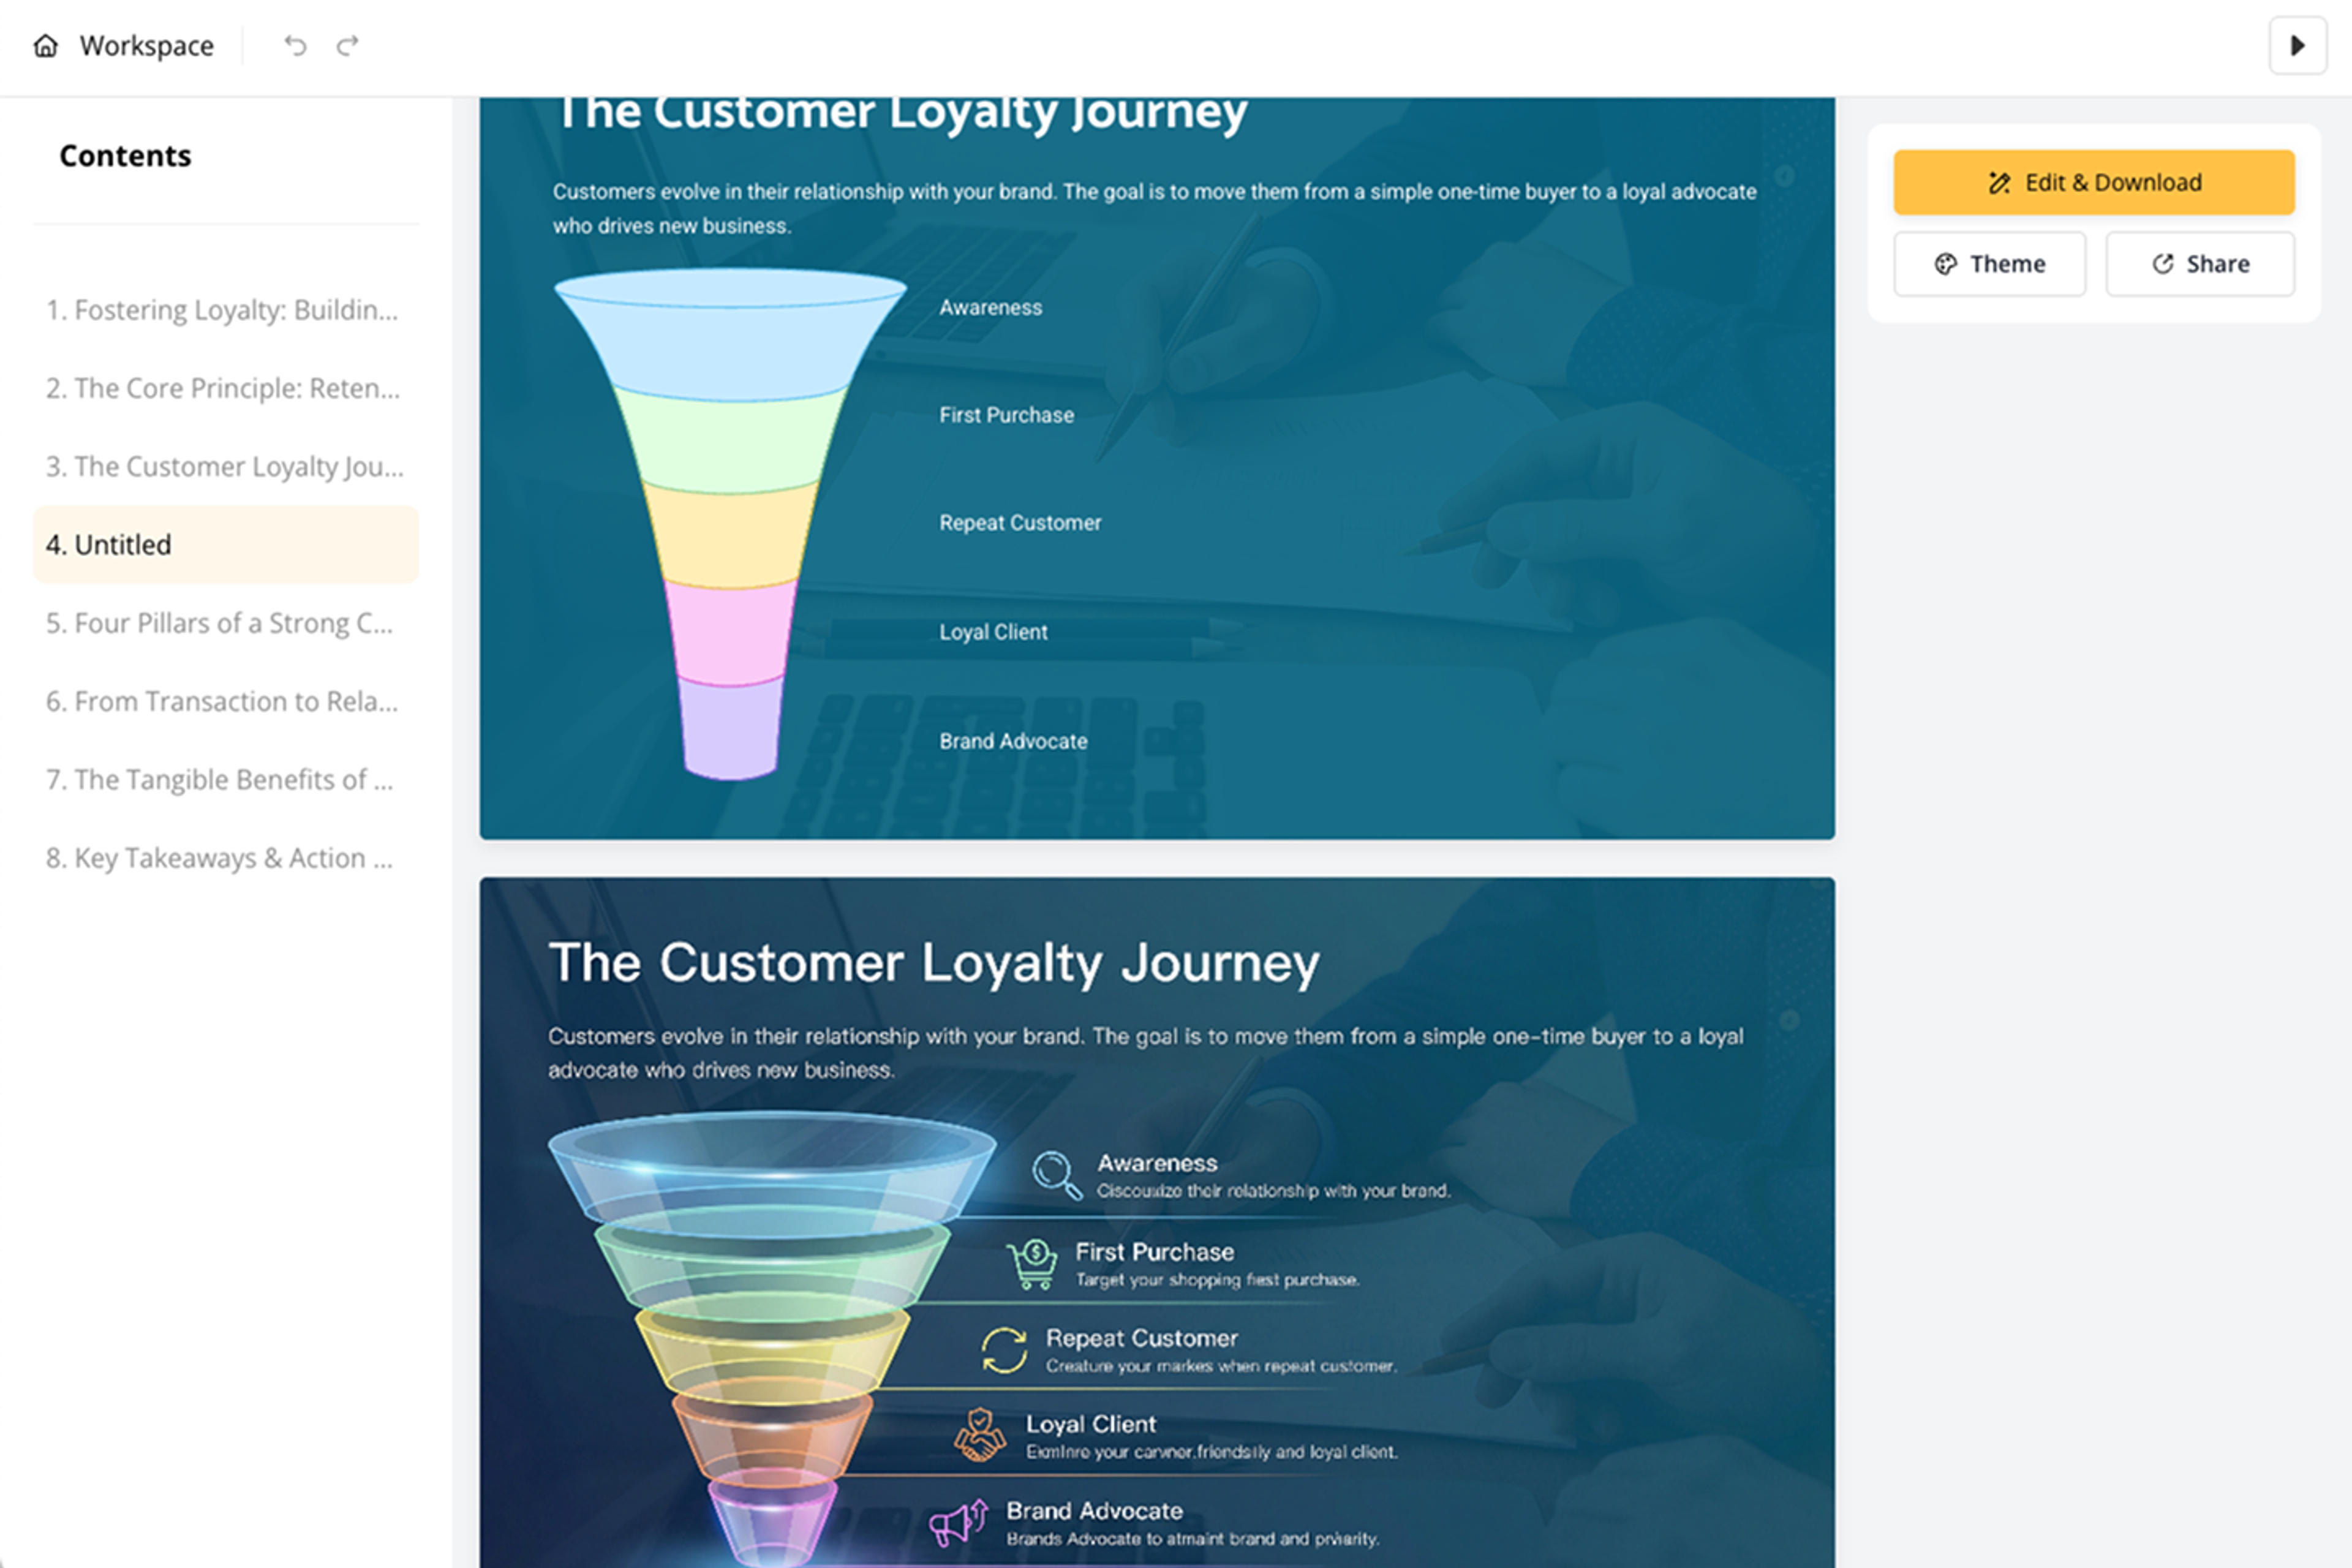
Generate a professional quarterly report deck with performance overview, KPI context, movement drivers, insights, risks, priorities, and takeaways. The presentation is built for decision review.
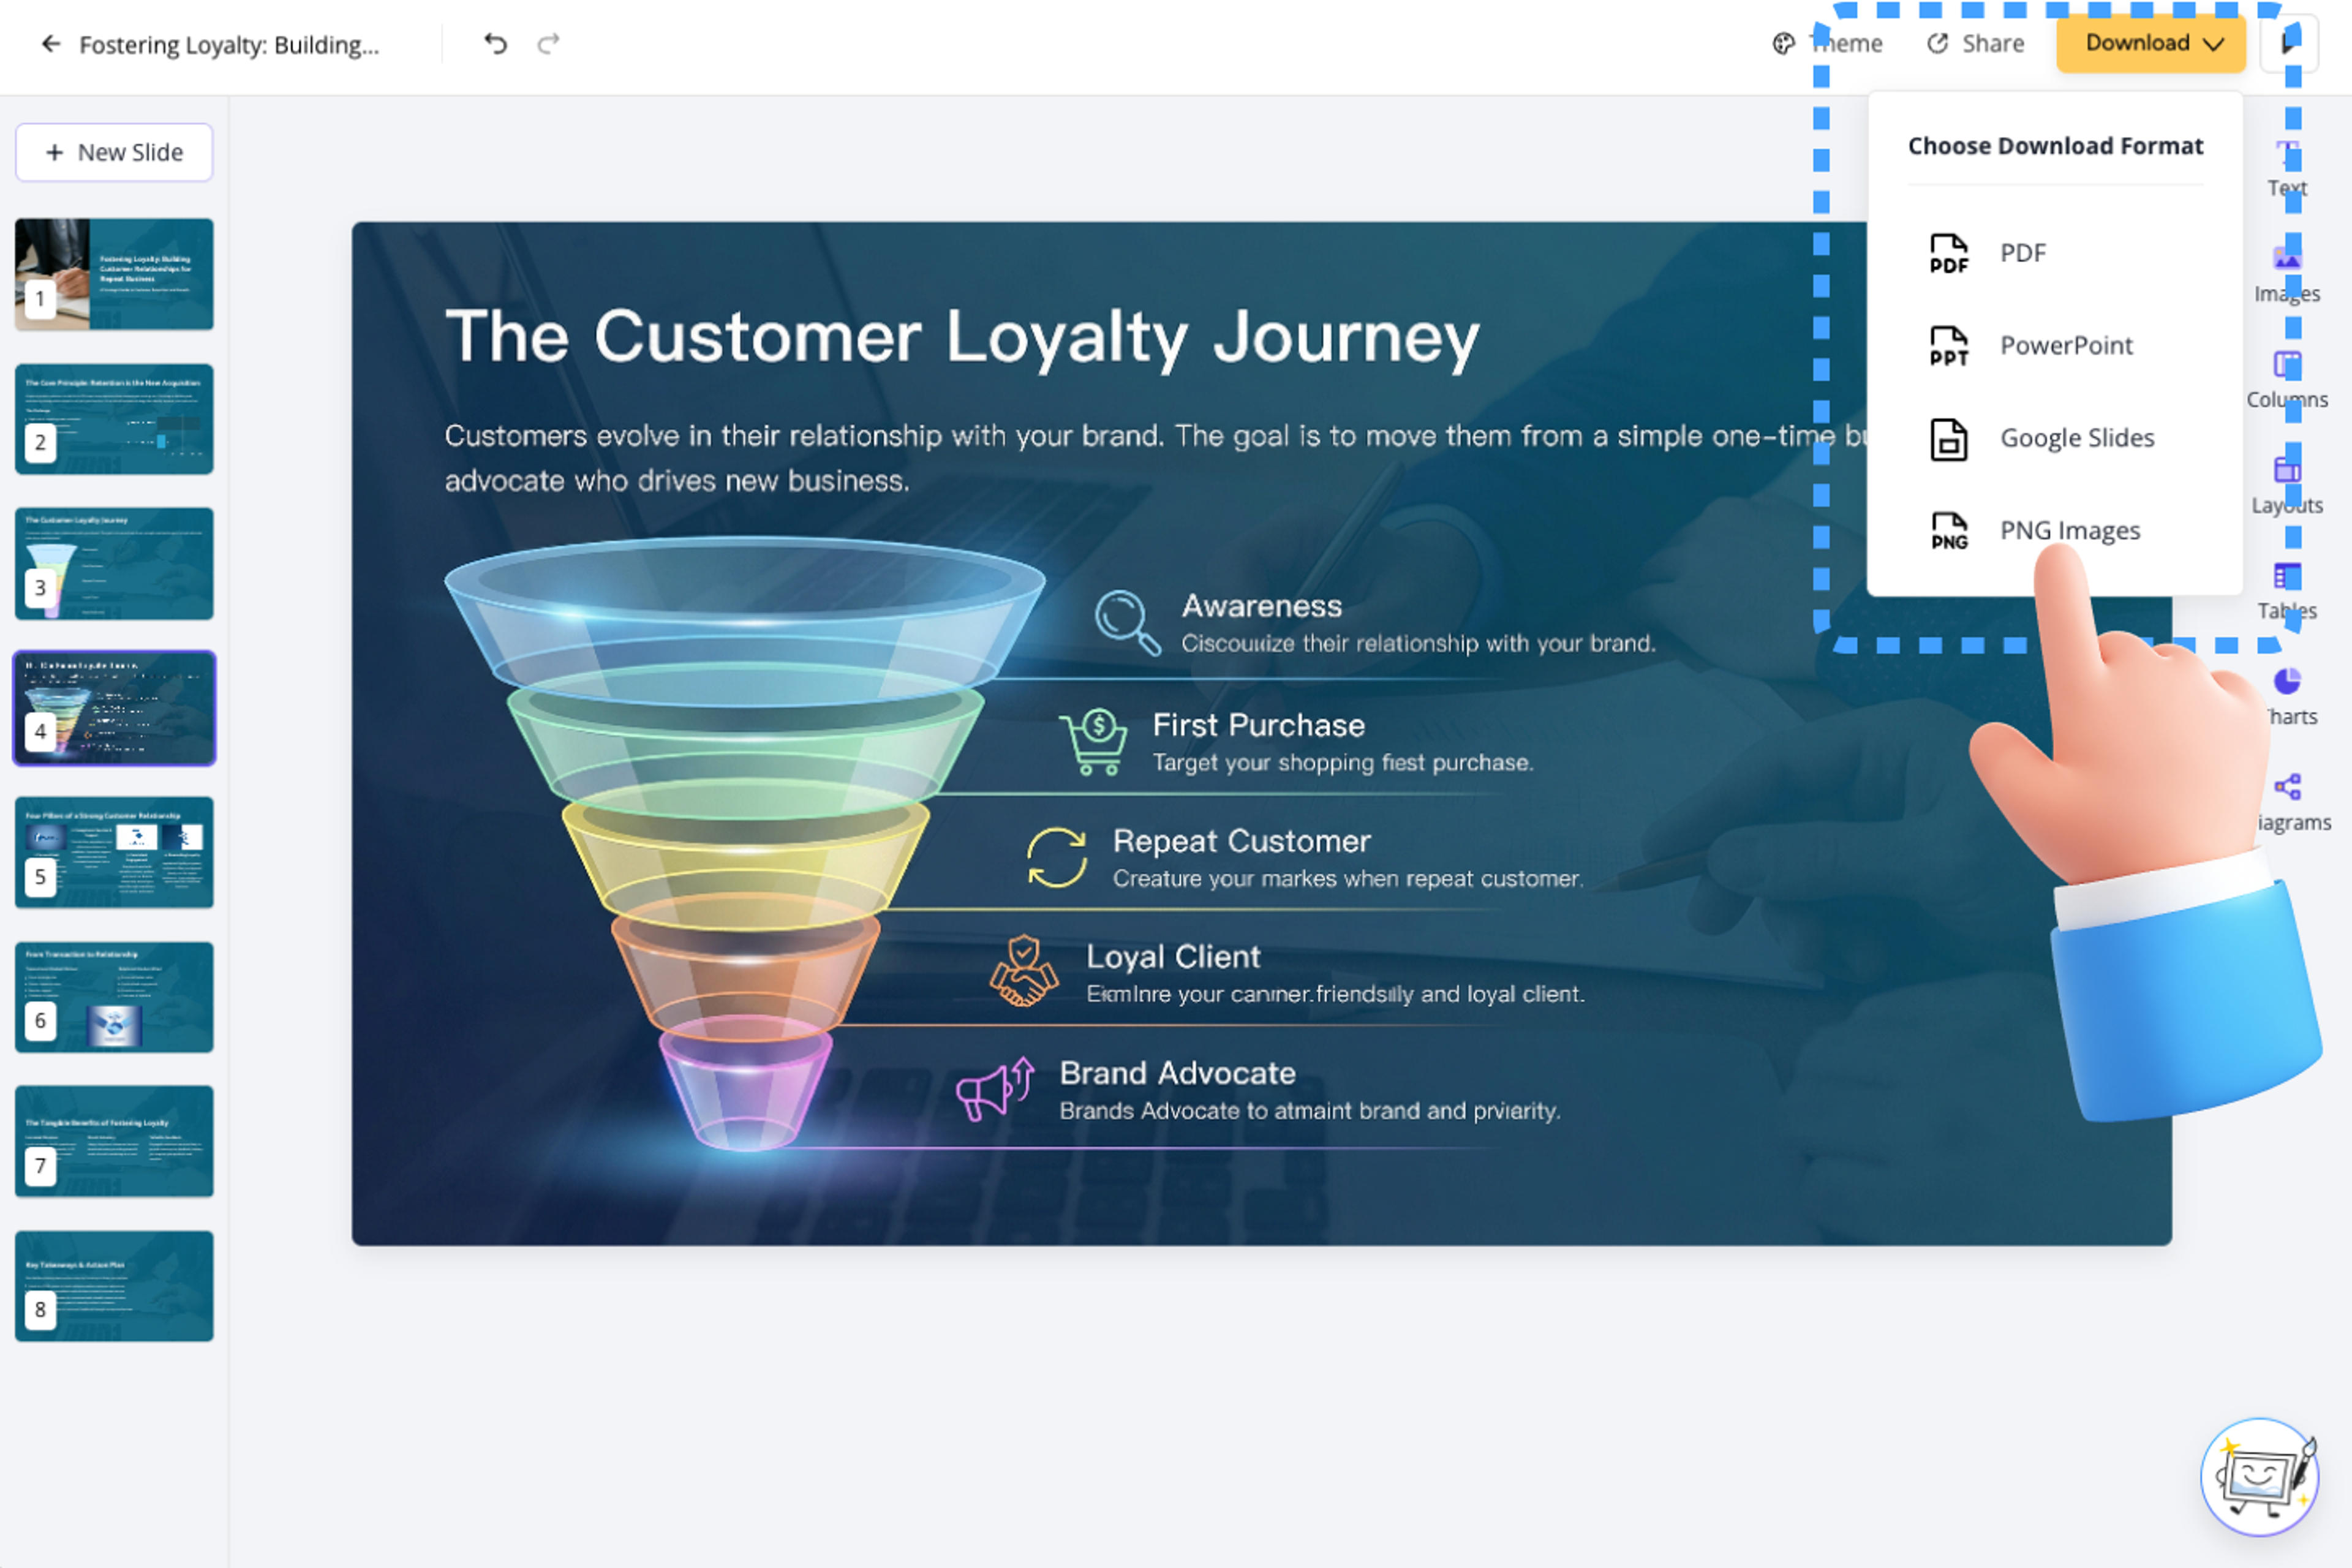
Refine chart wording, executive summary, section order, visual hierarchy, and next-step language before export. Create versions for leadership, board, customer, or department audiences.
Quarterly business reports need executive clarity. SlidesPilot focuses on KPI narrative, drivers, insight, priority, and next action.

Metrics become a story about performance and business movement. Leaders can see what changed and why it matters.

Drivers, wins, misses, risks, and customer signals are organized into readable sections. This makes quarterly reporting more actionable.

Next-quarter priorities and initiatives can be connected to the performance story. The deck moves naturally from review to action.

The editable output supports QBRs, leadership reviews, board updates, and client meetings. Teams can tailor detail level and tone.
Yes. Upload the report, QBR deck, KPI notes, charts, or executive update and SlidesPilot can create a polished presentation with performance narrative, insights, priorities, and next steps.
A strong QBR deck usually includes executive summary, KPI movement, key drivers, wins, risks, customer or revenue signals, initiatives, and next-quarter priorities.
Yes. KPI commentary, chart labels, metric movement, and driver explanations can be clarified so leaders understand the performance story faster.
Yes. Set the audience as client-facing and emphasize progress, value delivered, insights, open priorities, and next steps. You can refine tone before sharing.
Quarterly Business Report polishing focuses on recurring performance reporting and QBR decks. Consultant Reports to PPT focuses on advisory analysis and recommendations.
Yes. You can revise charts, wording, priorities, slide order, visual hierarchy, and executive summary before exporting the editable PowerPoint.
Use this page for quarterly reporting and QBR polish. Choose consultant-report, business-plan, project-proposal, or meeting workflows when the source is advisory, strategic, approval-focused, or action-recapped.
Transform plain PowerPoint presentations into professional designs using AI
Transform detailed reports into executive PowerPoint presentations
Transform dense financial data into clear PowerPoint presentations
Turn complex financial reporting into a clear executive summary
Transform meeting notes into professional PowerPoint presentations
Use AI Presentation Generator when that workflow better matches your source or output.
Transform your work into a presentation, instantly. ⭐ #1 AI PowerPoint Generator | Trusted by 3 million users worldwide